The Mushkin Source 500GB SATA SSD Review: A Value Proposition For An Everyday PC
by Billy Tallis on November 21, 2018 10:00 AM ESTSequential Read Performance
Our first test of sequential read performance uses short bursts of 128MB, issued as 128kB operations with no queuing. The test averages performance across eight bursts for a total of 1GB of data transferred from a drive containing 16GB of data. Between each burst the drive is given enough idle time to keep the overall duty cycle at 20%.
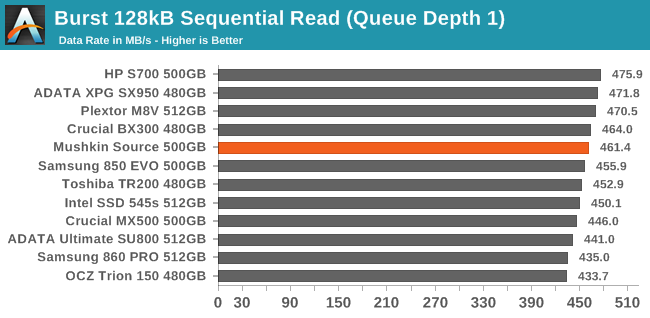
The Mushkin Source turns in respectable performance on the burst sequential read test, and the DRAMless design is clearly not a handicap at all for this workload.
Our test of sustained sequential reads uses queue depths from 1 to 32, with the performance and power scores computed as the average of QD1, QD2 and QD4. Each queue depth is tested for up to one minute or 32GB transferred, from a drive containing 64GB of data. This test is run twice: once with the drive prepared by sequentially writing the test data, and again after the random write test has mixed things up, causing fragmentation inside the SSD that isn't visible to the OS. These two scores represent the two extremes of how the drive would perform under real-world usage, where wear leveling and modifications to some existing data will create some internal fragmentation that degrades performance, but usually not to the extent shown here.
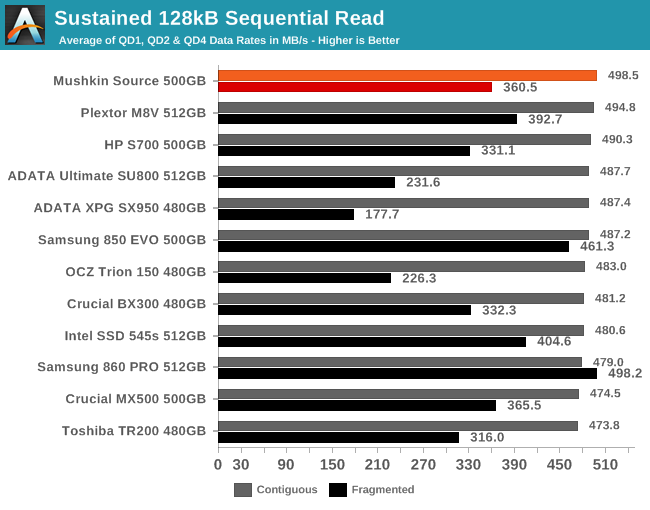
On the longer sequential read test, the Mushkin Source maintains high performance both for the initial test run reading back data that was written sequentially, and when reading from a dataset that was fragmented by the random write tests.
 |
|||||||||
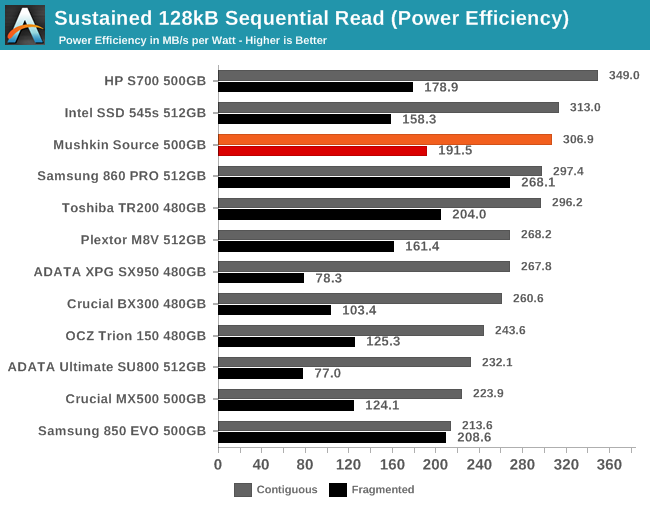
| Power Efficiency in MB/s/W | Average Power in W | ||||||||
With sequential read performance that is competitive against mainstream drives and a slight power consumption advantage from not having to power DRAM, the Mushkin Source turns in very good power efficiency scores, though not quite as high as the HP S700 managed.
 |
|||||||||
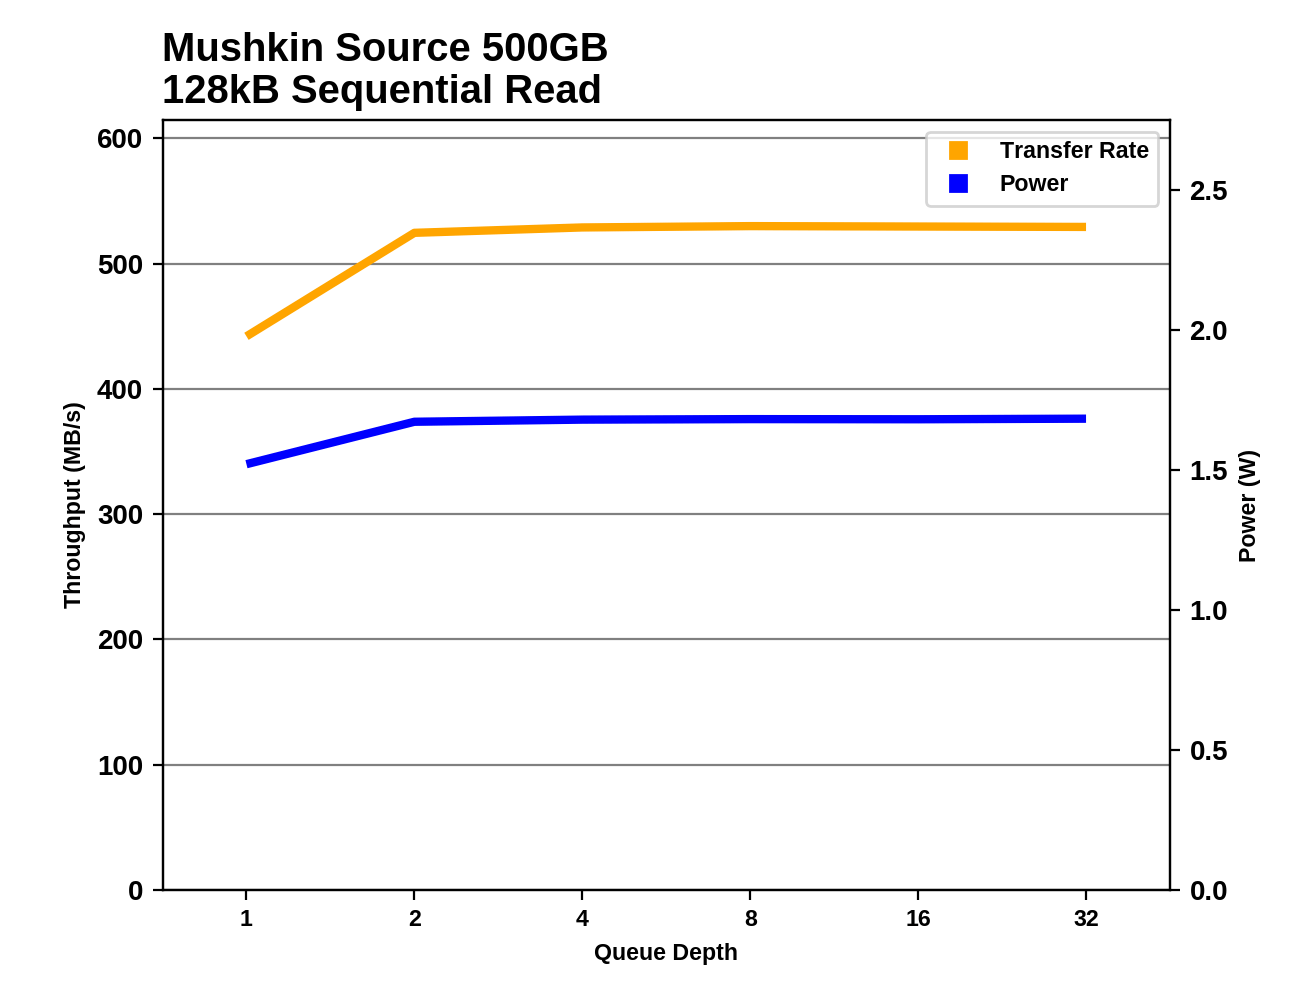
Like any SATA SSD, the Mushkin Source can't quite saturate the SATA interface at QD1. At any higher queue depth, the Source delivers steady full-speed sequential reads.
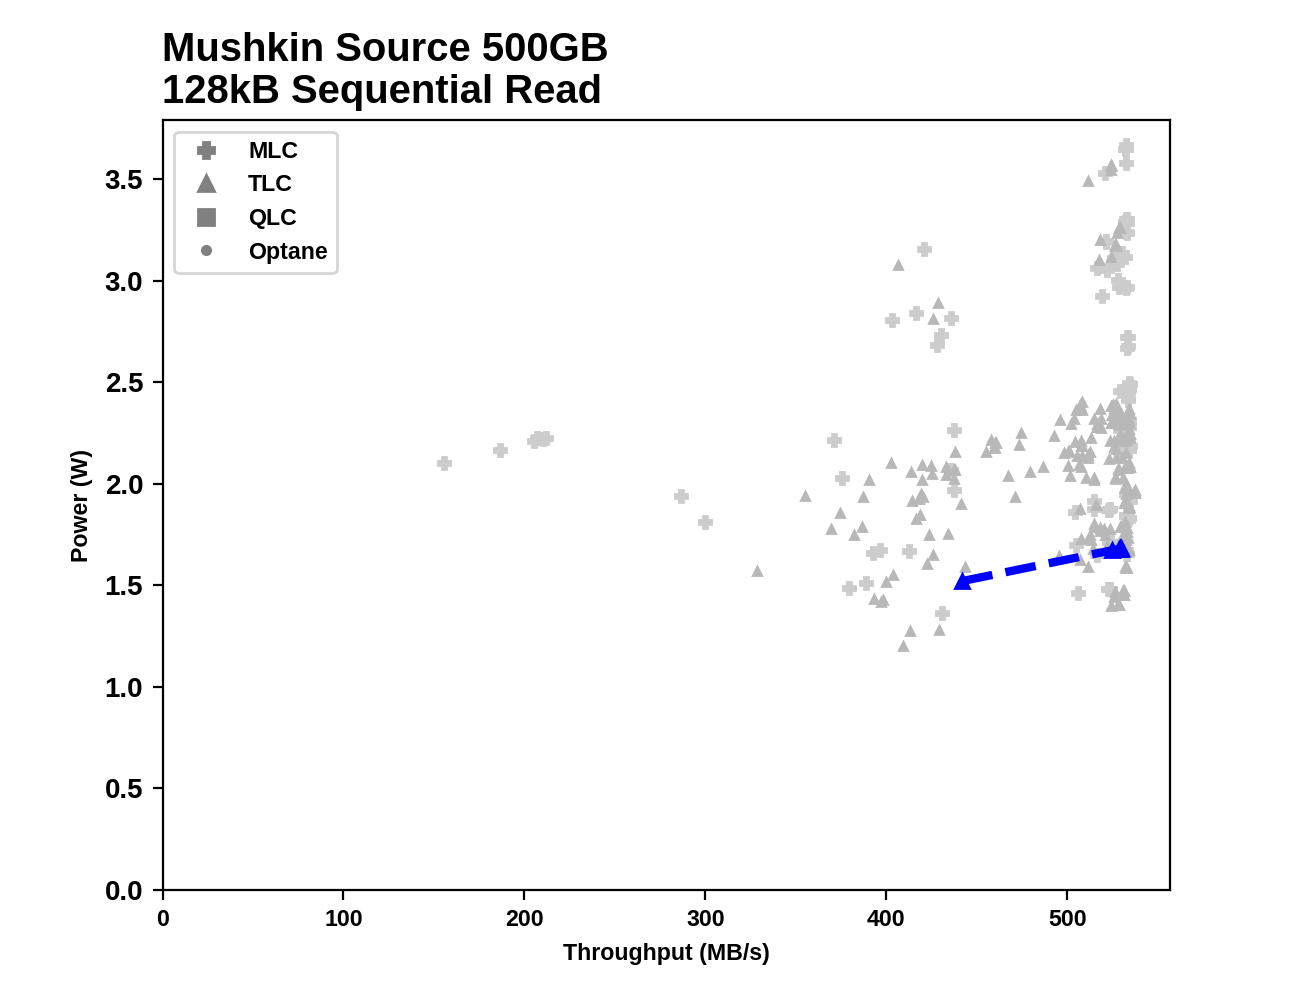
While the random access performance and power consumption of the Mushkin Source may not have looked good in the broader picture, for sequential reads the Mushkin Source is clearly as fast as any other SATA drive and draws less power than almost any other.
Sequential Write Performance
Our test of sequential write burst performance is structured identically to the sequential read burst performance test save for the direction of the data transfer. Each burst writes 128MB as 128kB operations issued at QD1, for a total of 1GB of data written to a drive containing 16GB of data.
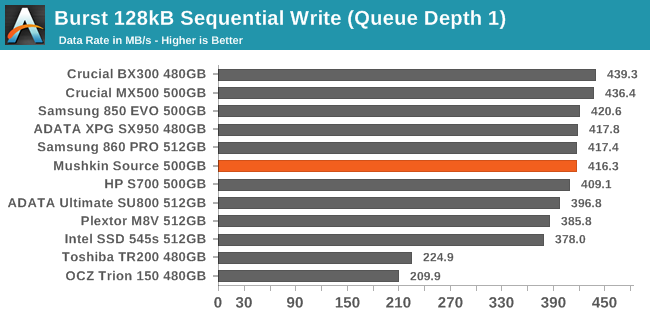
The burst sequential write performance of the Mushkin Source isn't quite top-tier, but it is comparable to most mainstream SATA SSDs.
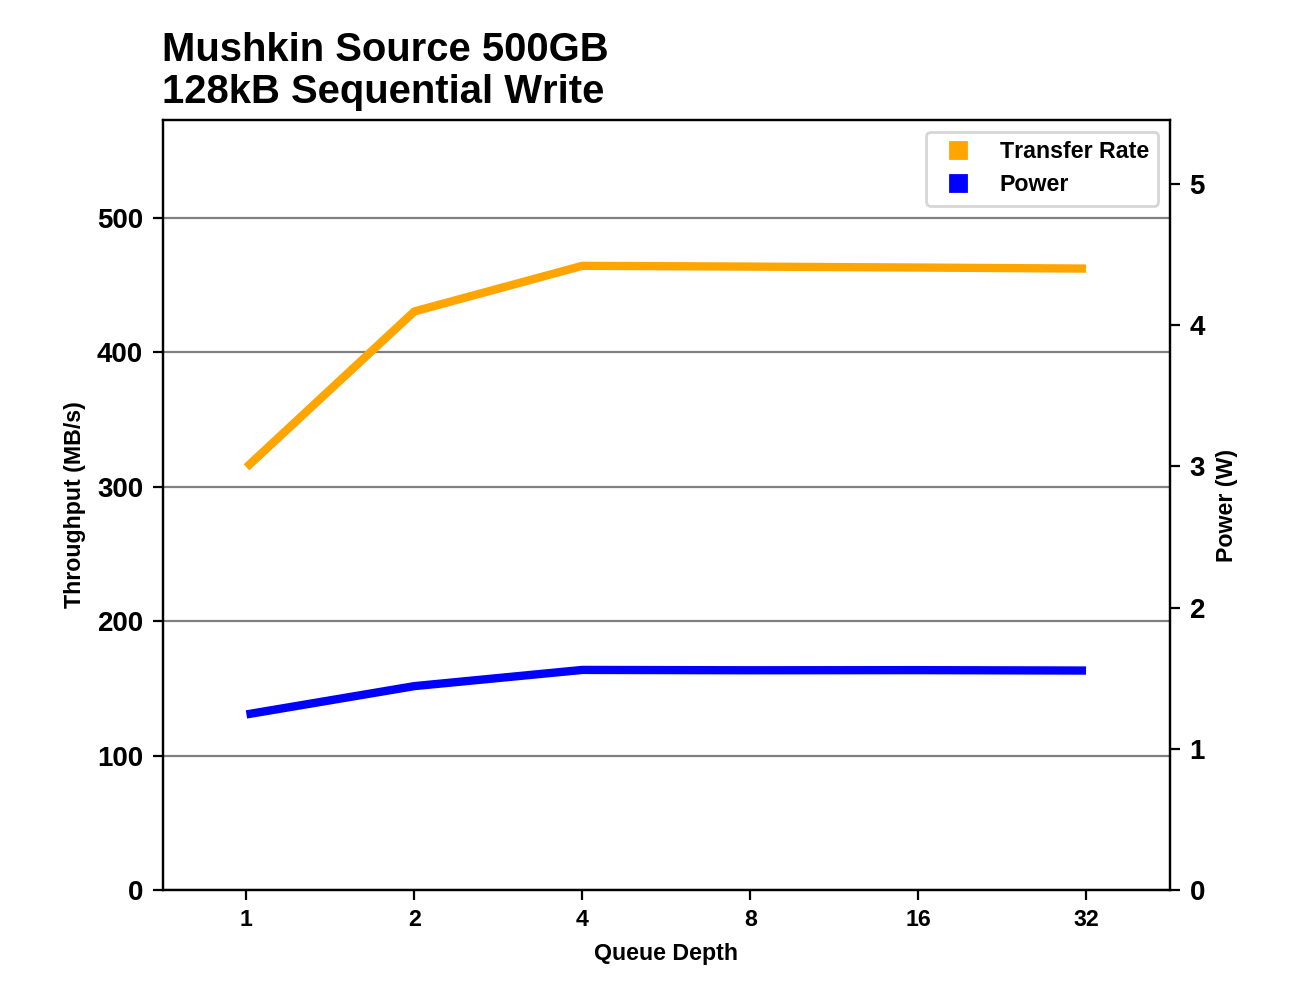
Our test of sustained sequential writes is structured identically to our sustained sequential read test, save for the direction of the data transfers. Queue depths range from 1 to 32 and each queue depth is tested for up to one minute or 32GB, followed by up to one minute of idle time for the drive to cool off and perform garbage collection. The test is confined to a 64GB span of the drive.
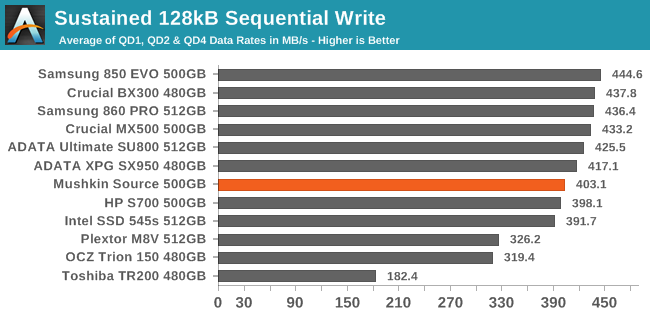
On the longer sequential write test, the Mushkin Source's standing falls somewhat, but it still offers decent performance, unlike the Toshiba TR200.
 |
|||||||||
| Power Efficiency in MB/s/W | Average Power in W | ||||||||
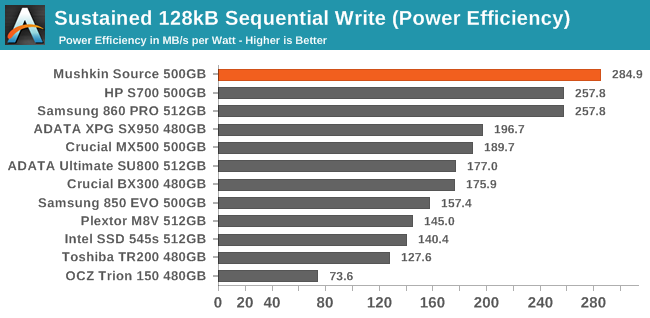
Every other SATA SSD in this batch uses at least as much power during this test as the Mushkin Source, which easily tops the efficiency ranking.
 |
|||||||||
The Mushkin Source doesn't reach its full sequential write speed until QD4, which is later than some drives but not uncommon even among mainstream SATA SSDs. The Source maintains that performance through the remainder of the test, with no sign of the SLC cache overflowing.
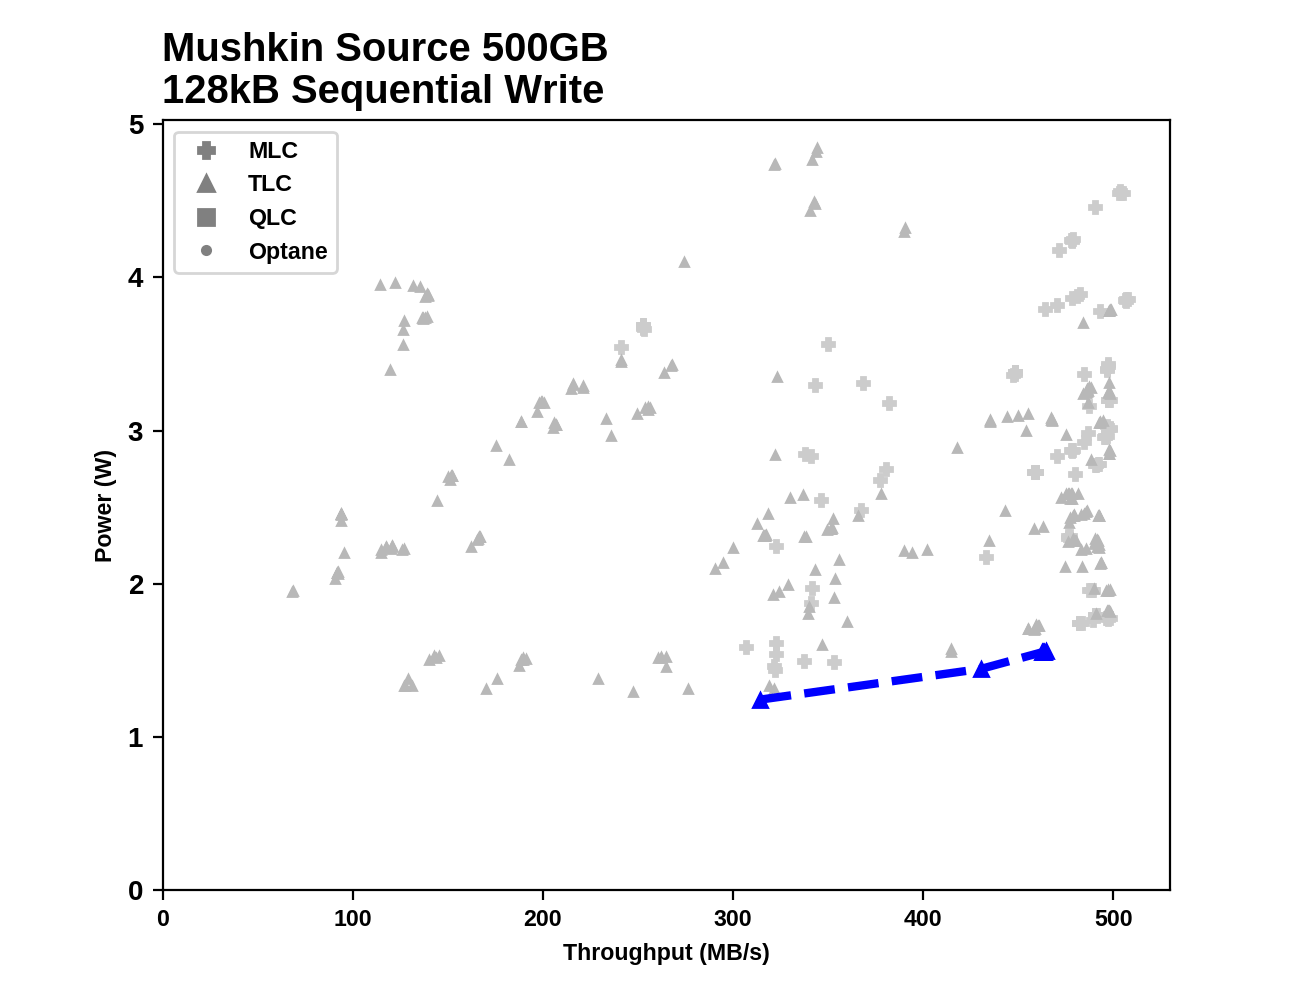
The Mushkin Source may not quite reach the highest sequential write speeds possible for a SATA SSD, but it gets pretty close and is obviously the most efficient SATA drive we've put through this test. That's a strange win, but we'll take it.


30 Comments
View All Comments
Adramtech - Thursday, November 22, 2018 - link
what are you referring to? This uses Micron and it's TLCgglaw - Saturday, November 24, 2018 - link
lol yea, are people not even reading these articles? It is using one of the best selling controllers with a great track record for a low cost one, with Micron's 64L 3D-NAND which also speaks for itself. There is nothing "risky" with this drive. Every aspect of it is very well known.Lolimaster - Thursday, November 22, 2018 - link
Till now you can still get the Samsung 860 EVO for $130.Darcey R. Epperly - Friday, November 23, 2018 - link
Good drive to speed up my Gaming Console. I don't need a high write performance.Samus - Friday, November 23, 2018 - link
Always nice to see competition, but still hard to consider this over an MX500 that sells for virtually the same price.nwarawa - Friday, November 23, 2018 - link
70MB/s seq write?! REALLY?! Makes it garbage as an upgrade. This SSD would be the bottleneck transferring from a HDD... smh.Billy Tallis - Friday, November 23, 2018 - link
Yes, but how often do you really transfer more than 150GB at a time? Even putting a full OS+apps image onto the drive probably wouldn't do that much writing in one shot. If you're only writing tens of GB at a time, this drive is still twice as fast as a hard drive.nwarawa - Friday, November 23, 2018 - link
Personally? Often. I move video folders between drives often as the projects go to cold storage. Laughable that this would be slower than my 4tb HDD at this task. But I upgrade people from HDD storage, or even smaller SSD, ALL THE TIME. MX500 or 860 EVO will image an existing 250GB so much faster.gglaw - Saturday, November 24, 2018 - link
To be fair that's a TINY niche scenario no budget drive is trying to fill. Having a performance drop after >150GB of data is transferred is something most users will encounter a couple times a year at most. Even if they are doing a full drive migration, as Billy pointed it, for most users it won't past the threshold and this is the one and only time a typical user MIGHT encounter the problem. If it adds 5 minutes to the clone time for the handful of GB after 150GB is cloned, that's the least of most users problems.The current prices make no sense either way though. It is way too close to the MX500, but the prices will have to settle into sensible patterns or these will just rot away in warehouses. I imagine the actual sell prices will end up significantly lower than MSRP. For any of my spare home rigs or office computers, the limitations of performance drop after 150GB would not bother me one bit as long as it saved enough cost to justify it. I would gladly take even a steep dropoff at 50GB if it saved several more bucks. The times I would be transferring more than this I would either A) be using my main computer or B) not sitting there waiting on the transfer/clone. I build or upgrade enough systems that anytime a workload even passes the 5 min mark, there's something else I could be working on (or sneaking in another OW match).
dromoxen - Sunday, December 9, 2018 - link
the price paid in the retail market , specifically Western Markets, is not indicative of the price OEM's pay or say LA/Far Eatern markets .I am noticing a bias against Chinese Brands simply based on their Chinesity?, is this how we stop them taking over the PC components world? HUAWEI e.g.