The Mushkin Source 500GB SATA SSD Review: A Value Proposition For An Everyday PC
by Billy Tallis on November 21, 2018 10:00 AM ESTMixed Random Performance
Our test of mixed random reads and writes covers mixes varying from pure reads to pure writes at 10% increments. Each mix is tested for up to 1 minute or 32GB of data transferred. The test is conducted with a queue depth of 4, and is limited to a 64GB span of the drive. In between each mix, the drive is given idle time of up to one minute so that the overall duty cycle is 50%.
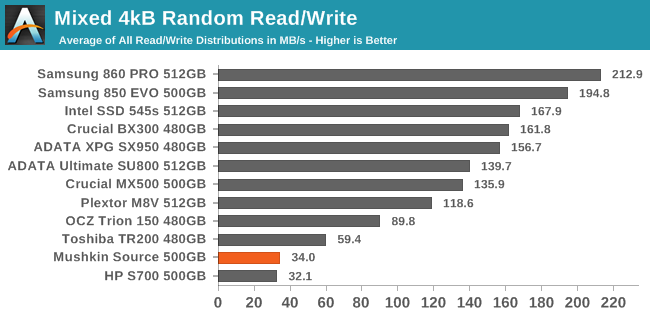
The Mushkin Source does not handle the mixed random I/O test well at all, with performance that is barely faster than the HP S700 and much slower than the Toshiba TR200, let alone the mainstream SATA SSDs that have a DRAM cache.
 |
|||||||||
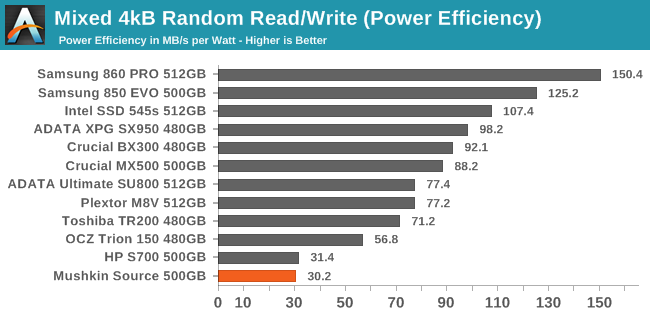
| Power Efficiency in MB/s/W | Average Power in W | ||||||||
The Mushkin Source uses a bit more power than the HP S700 on this test, so it ends up falling to last place on the power efficiency ranking. The Toshiba TR200 uses less power than the other two DRAMless drives and substantially outperforms them, so its efficiency is close to competitive against the mainstream drives.
 |
|||||||||
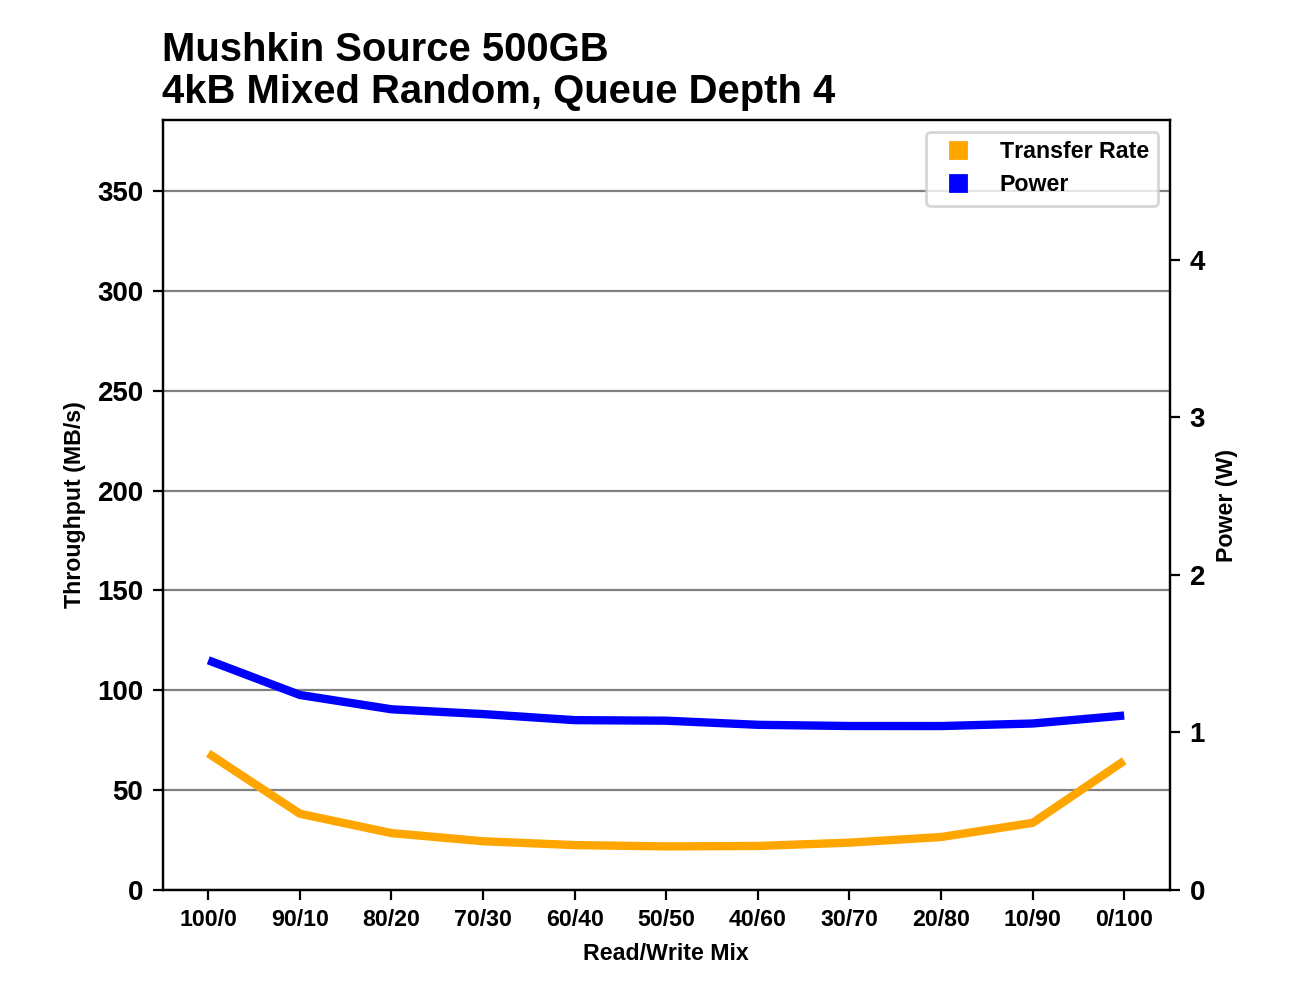
The Mushkin Source displays a typical bathtub curve for performance on the mixed random I/O test. With pure reads or pure writes, it is substantially faster than with any mix, and the lowest performance is with around a 50/50 mix of reads and writes. Most mainstream SATA SSDs these days show significant performance growth throughout the test as the workload becomes more write-heavy, finishing with a significant spike in performance at the end when the SLC cache can be used to the greatest extent possible.
Mixed Sequential Performance
Our test of mixed sequential reads and writes differs from the mixed random I/O test by performing 128kB sequential accesses rather than 4kB accesses at random locations, and the sequential test is conducted at queue depth 1. The range of mixes tested is the same, and the timing and limits on data transfers are also the same as above.
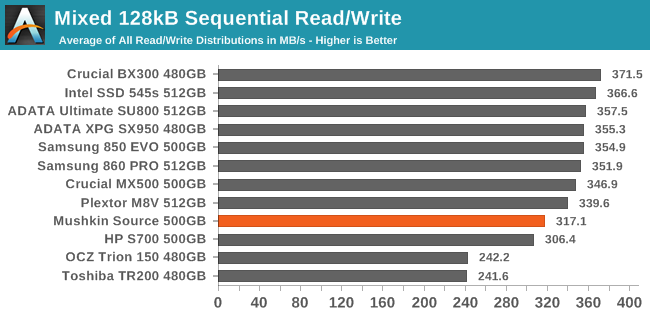
The Mushkin Source comes close to the performance of mainstream SATA SSDs on the mixed sequential I/O test, but it is still handicapped slightly by the DRAMless controller despite having turned in competitive scores in the tests of pure sequential reads and writes.
 |
|||||||||
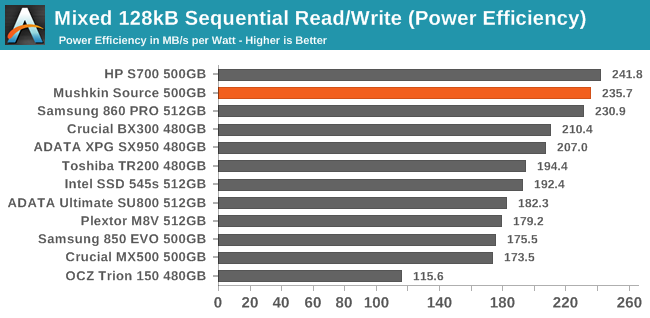
| Power Efficiency in MB/s/W | Average Power in W | ||||||||
Unsurprisingly, the Mushkin Source continues its trend of very good power efficiency during sequential I/O, ranking just below the HP S700 and above all the mainstream SATA SSDs.
 |
|||||||||
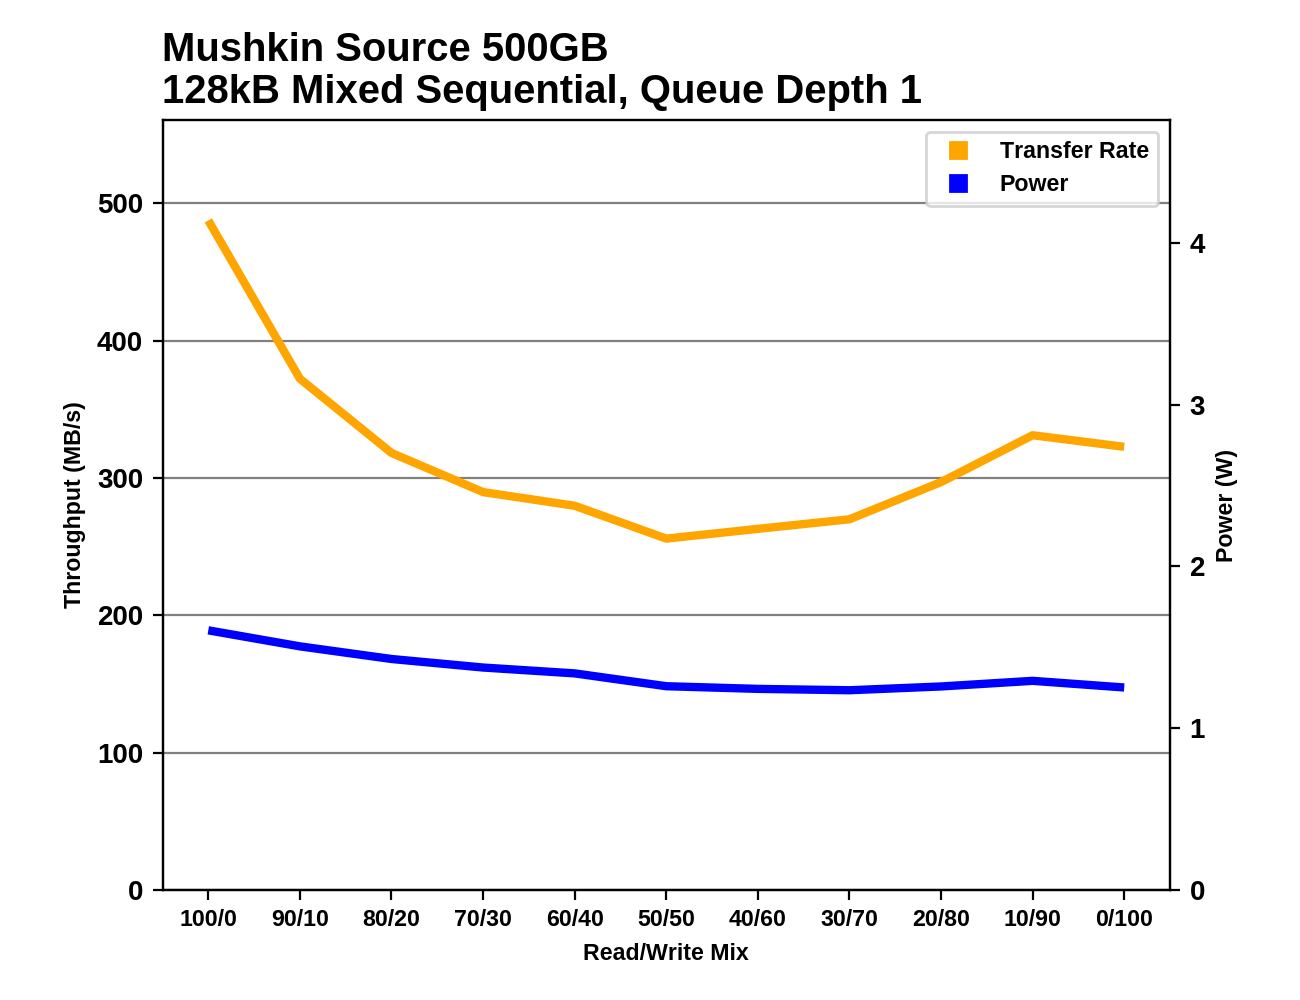
The Mushkin Source's behavior on the mixed sequential I/O test is quite similar to the HP S700: a steep decline in performance during the first half of the test as the workload shifts from pure reads to a 50/50 mix, followed by a moderate performance recovery. The mainstream SATA SSDs that show higher overall performance win out during the middle phases of the test, where they lose less performance as writes are introduced.


30 Comments
View All Comments
benedict - Wednesday, November 21, 2018 - link
This needs to be less than 10$/GB to make any sense.deil - Wednesday, November 21, 2018 - link
it might be, wait 3-4 months from initial start. Still its cheapest 500 GB I've seen so far, and that is good sign.Small Bison - Wednesday, November 21, 2018 - link
Yeah, charging over five thousand dollars for a 500GB DRAM-less drive *does* seem like a bit much.excelle08 - Thursday, November 22, 2018 - link
Well you aren't referring to US Dollars, right?😂PeachNCream - Wednesday, November 21, 2018 - link
The scatter plots on pages 6 and 7 may benefit from the addition of color to differentiate storage types. As they stand, they're difficult to extract meaningful data from for a few reasons, but the worst offenders are too many data points in the given space and poor contrast between data types.Billy Tallis - Wednesday, November 21, 2018 - link
The purpose of those scatter plots isn't to enable comparing the highlighted drive against any particular competitor, but to show where it falls relative to the limits of what is possible/normal. The data points for the non-highlighted drives are deliberately low-contrast because their exact value or identity aren't what's important for that graph. They're supposed to blend into a cloud.PeachNCream - Wednesday, November 21, 2018 - link
Hmm, well I wasn't implying that there ought to be individual products highlighted. I was suggesting that using a categorical color in addition to the shape would help with overall visibility. For example, make TLC red, MLC green, and Optane black or something. It would allow us to extrapolate trend-like significance to the categories that were defined in the chart and position the Source among them.Great_Scott - Wednesday, November 21, 2018 - link
SSD prices are so compressed right now that I'm considering getting a Samsung 860 EVO... as the 'cheap' option.There's really no point in getting a 'budget' 2.5" form-factor drive as every brand falls within about a 10% total price range.
Ratman6161 - Wednesday, November 21, 2018 - link
Absolutely. In the SATA space, there is no reason to even look at anything other than the Samsung 860 EVO or the Crucial MX500. The 860 EVO is even cheaper than this piece of junk at the 1 TB level and only $7 less at 500 GB. There is no reason for this drive to exist unless they cut the price...a lot.heffeque - Wednesday, November 21, 2018 - link
Well the BX500 is a pretty decent drive and is somewhat cheaper than both 860EVO and MX500.