The Intel NUC8i7HVK (Hades Canyon) Review: Kaby Lake-G Benchmarked
by Ganesh T S on March 29, 2018 1:00 PM ESTPerformance Metrics - I
The Intel NUC8i7HVK (Hades Canyon) was evaluated using our standard test suite for small form-factor gaming PCs. Not all benchmarks were processed on all the machines due to updates in our testing procedures. Therefore, the list of PCs in each graph might not be the same. In the first section, we will be looking at SYSmark 2014 SE, as well as some of the Futuremark benchmarks.
BAPCo SYSmark 2014 SE
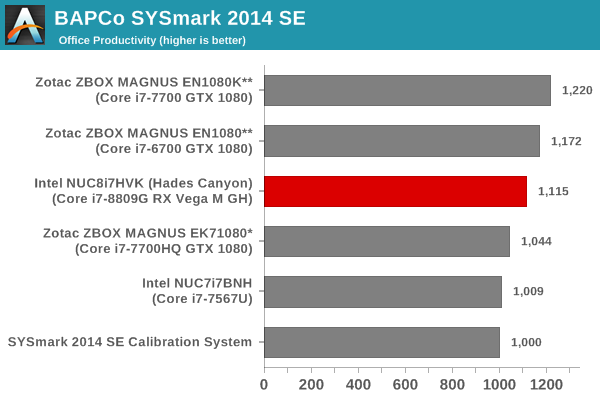
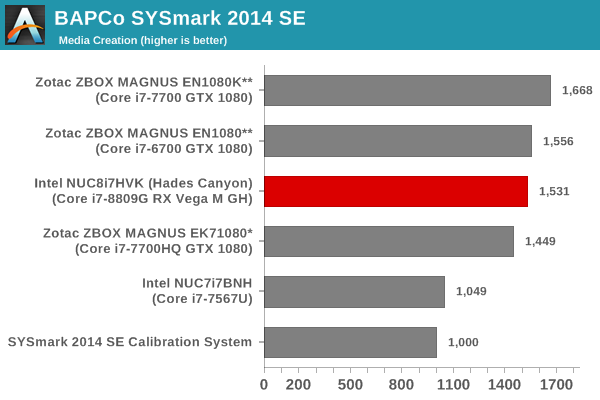
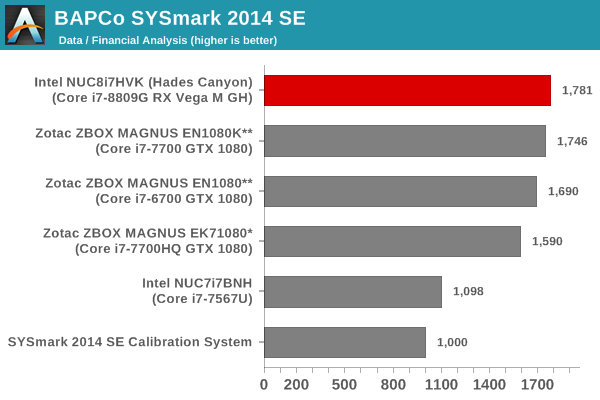
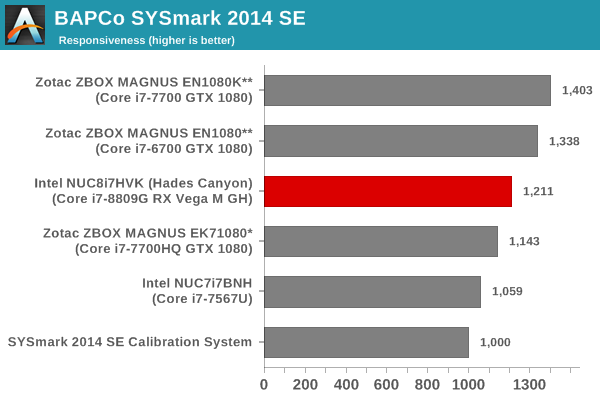
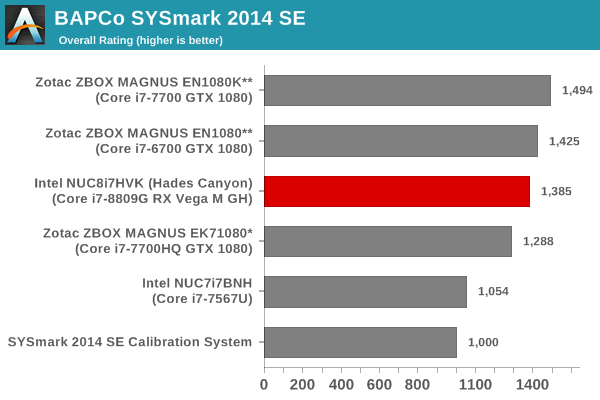
BAPCo's SYSmark 2014 SE is an application-based benchmark that uses real-world applications to replay usage patterns of business users in the areas of office productivity, media creation and data/financial analysis. In addition, it also addresses the responsiveness aspect which deals with user experience as related to application and file launches, multi-tasking etc. Scores are meant to be compared against a reference desktop (the SYSmark 2014 SE calibration system in the graphs below). While the SYSmark 2014 benchmark used a Haswell-based desktop configuration, the SYSmark 2014 SE makes the move to a Lenovo ThinkCenter M800 (Intel Core i3-6100, 4GB RAM and a 256GB SATA SSD). The calibration system scores 1000 in each of the scenarios. A score of, say, 2000, would imply that the system under test is twice as fast as the reference system.
SYSmark 2014 SE also adds energy measurement to the mix. A high score in the SYSmark benchmarks might be nice to have, but, potential customers also need to determine the balance between power consumption and the efficiency of the system. For example, in the average office scenario, it might not be worth purchasing a noisy and power-hungry PC just because it ends up with a 2000 score in the SYSmark 2014 SE benchmarks. In order to provide a balanced perspective, SYSmark 2014 SE also allows vendors and decision makers to track the energy consumption during each workload. In the graphs below, we find the total energy consumed by the PC under test for a single iteration of each SYSmark 2014 SE workload and how it compares against the calibration systems.
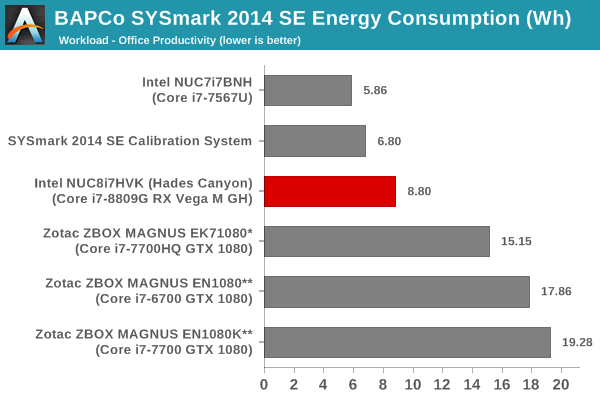
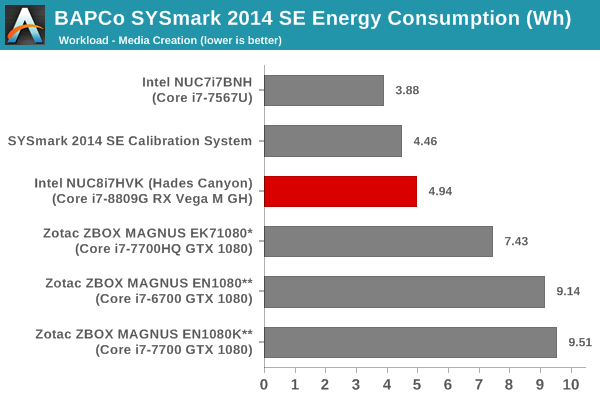
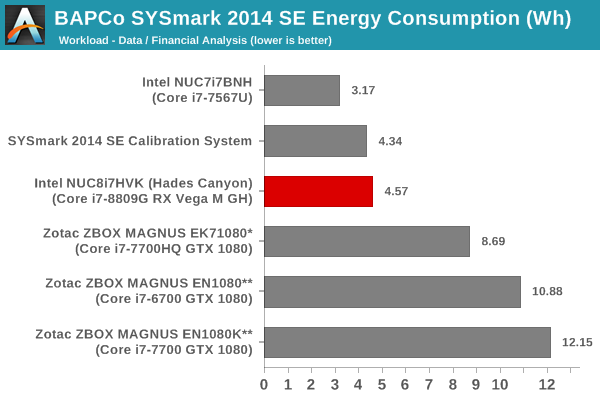

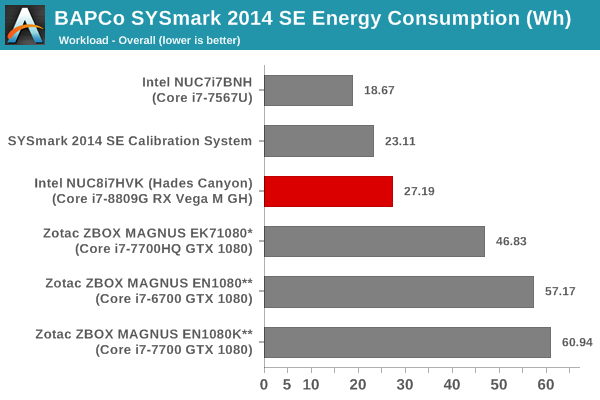
Despite being fully patched for Meltdown and Spectre, the Core i7-8809G manages to outscore the partially patched Core i7-7700HQ-based ZBOX MAGNUS EK71080. It is beat in terms of raw score by the ZBOX MAGNUS PCs using the desktop CPUs (Core i7-6700 and Core i7-7700), but, those PCs consume much more energy to complete the workloads.
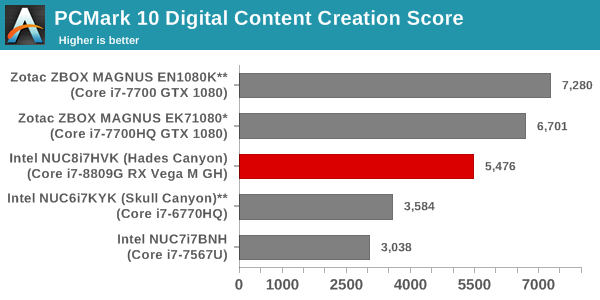
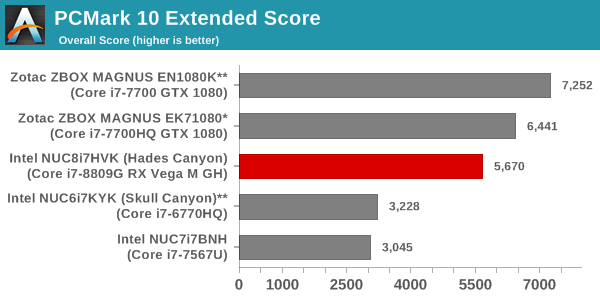
Futuremark PCMark 10
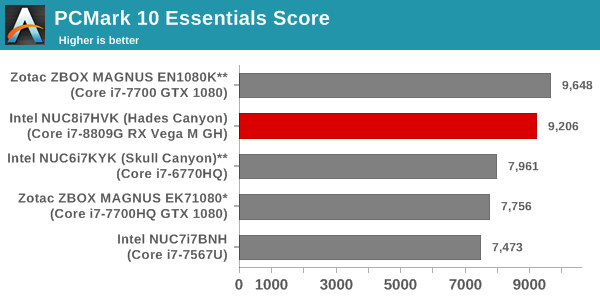
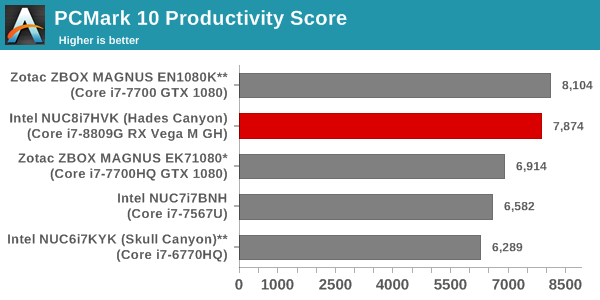
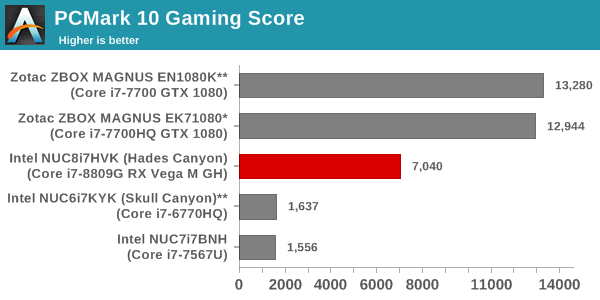
UL's PCMark 10 evaluates computing systems for various usage scenarios (generic / essential tasks such as web browsing and starting up applications, productivity tasks such as editing spreadsheets and documents, gaming, and digital content creation). We benchmarked select PCs with the PCMark 10 Extended profile and recorded the scores for various scenarios. These scores are heavily influenced by the CPU and GPU in the system, though the RAM and storage device also play a part. The power plan was set to Balanced for all the PCs while processing the PCMark 10 benchmark.
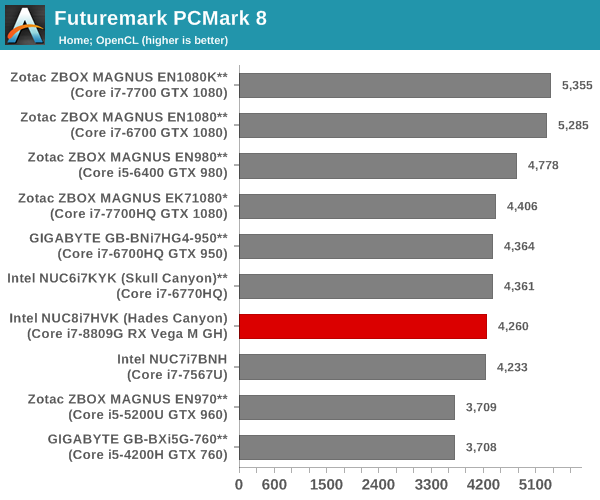
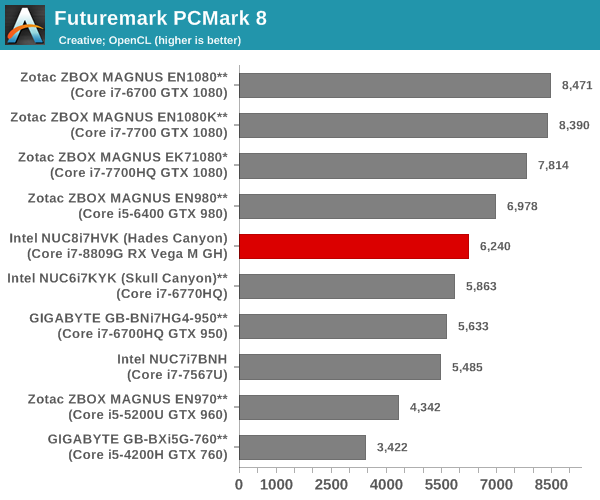
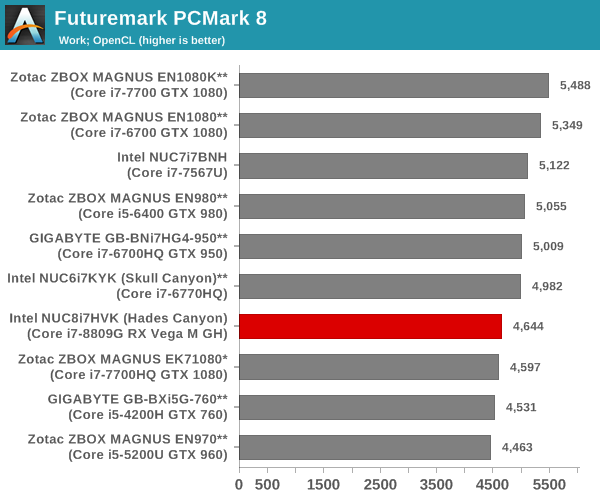
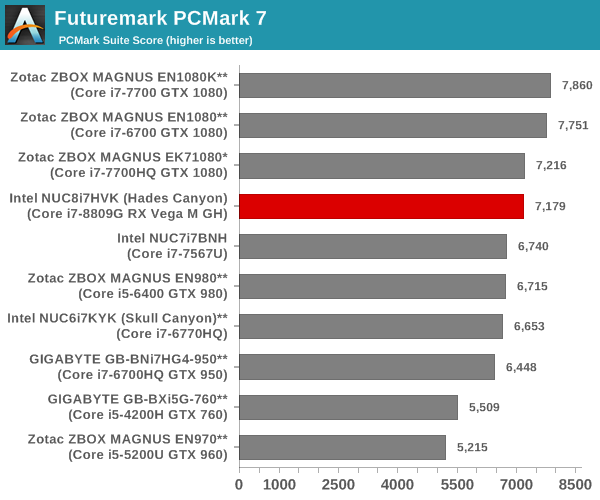
Futuremark PCMark 8
We continue to present PCMark 8 benchmark results (as those have more comparison points) while our PCMark 10 scores database for systems grows in size. PCMark 8 provides various usage scenarios (home, creative and work) and offers ways to benchmark both baseline (CPU-only) as well as OpenCL accelerated (CPU + GPU) performance. We benchmarked select PCs for the OpenCL accelerated performance in all three usage scenarios. These scores are heavily influenced by the CPU in the system. The results should be analyzed while keeping in mind that most of the comparison systems have scores from the days prior to the release of the Meltdown and Spectre patches.
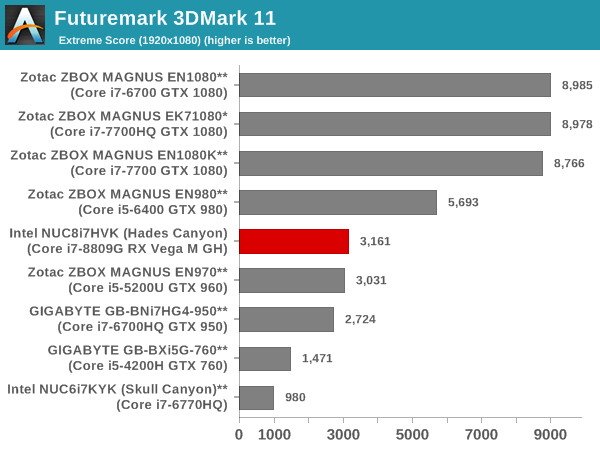
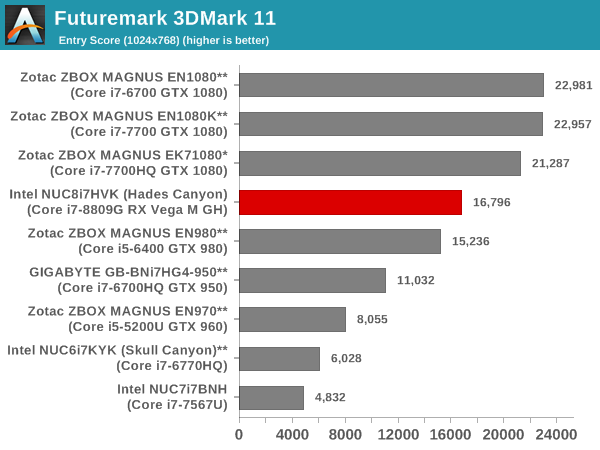
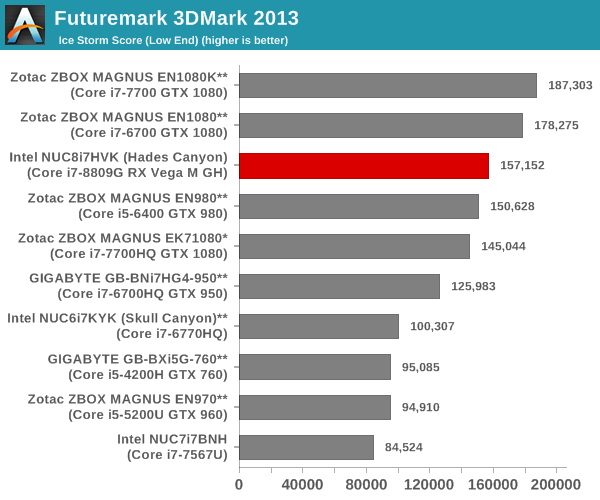
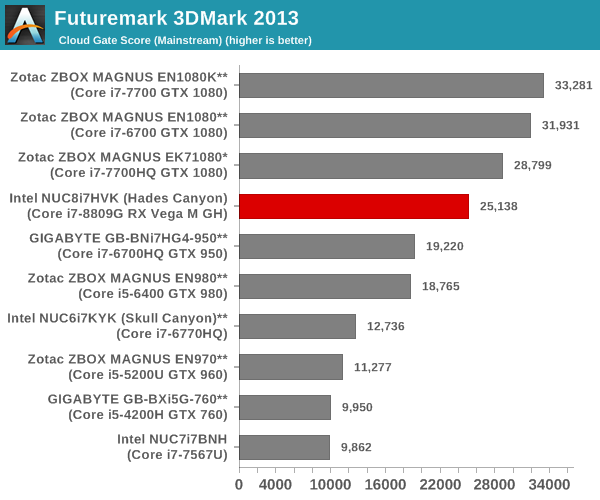
Miscellaneous Futuremark Benchmarks
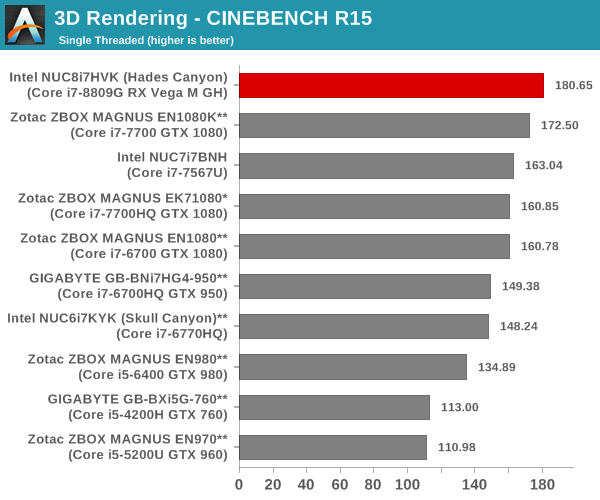
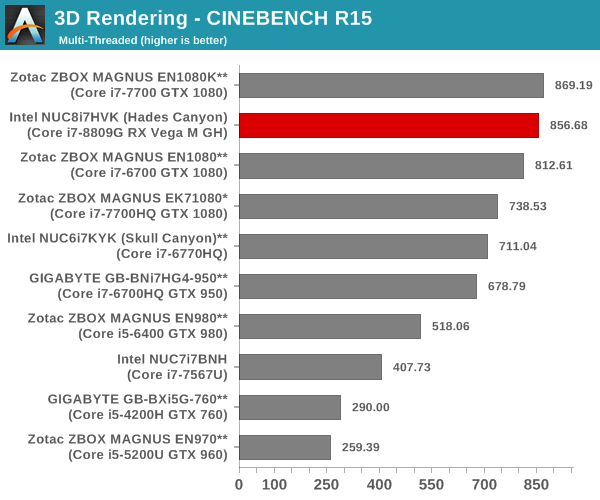
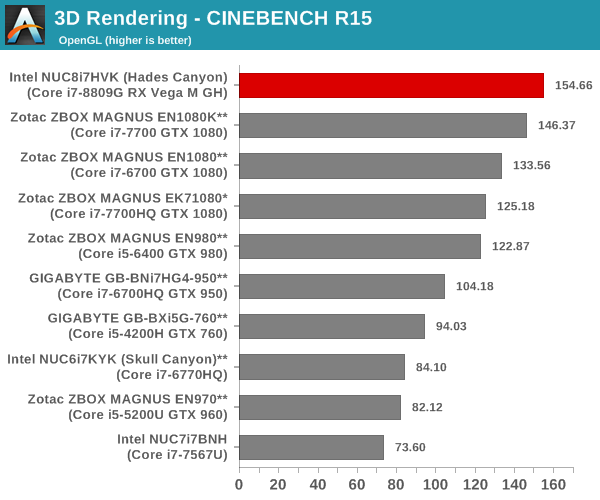
3D Rendering - CINEBENCH R15
We have moved on from R11.5 to R15 for 3D rendering evaluation. CINEBENCH R15 provides three benchmark modes - OpenGL, single threaded and multi-threaded. Evaluation of select PCs in all three modes provided us the following results. Here, we see the benefits of running the CPU die with a 65W TDP. The scores match or beat the results from the Core i7-7700 in the ZBOX MAGNUS EN1080K.


124 Comments
View All Comments
Hifihedgehog - Monday, April 2, 2018 - link
PS: Raven Ridge’s claim to fame is support for fixed function 10-bit VP9 decoding.tomshardware (dot) co (dot) uk/amd-ryzen-5-2400g-zen-vega-cpu-gpu,review-34205-4.html
kunal29 - Saturday, March 31, 2018 - link
What about the latency benchmarks between GPU and CPU?beginner99 - Sunday, April 1, 2018 - link
Not being able to play UHD BluRay basically kills the product as HTPC which limits it to gaming and that is a steep price to ask just for that. My effing TV can play 4k HDR but this $1300 PC can't???Tyler_Durden_83 - Monday, April 2, 2018 - link
Here is an idea, the benchmarks as images are so last decade, seeing the review of the zotac without the benchmarks of hades canyon just because it came out one day earlier, or with a terribly old xps 15 model even though you did bench the latest, is quite frankly not the high standard that people expect from Anandkmmatney - Monday, April 2, 2018 - link
This is a nice system, but still way too expensive. You can get a gaming laptop with 15" screen, 7700HQ cpu, RAM, Windows OS, usually an SSD OS drive, and a GTX 1060 for around this barebone price. Even less if you go for a 1050 Ti, which is about equivalent to this. It's impressive, but I just have never gotten the point of these expensive NUCs.JKJK - Tuesday, April 3, 2018 - link
lack of UHD/HDR support in many cases and those kodi freezes .... meh.I would like to see some update on these freeze-issues in the future.
HakkaH - Tuesday, April 3, 2018 - link
Too bad they didn't throw in the AMD 200G and 2400G with the benchmarks. You can build a small system with it which would be a whole lot cheaper and probably pretty decent when it comes to gaming speed.Dev3 - Thursday, April 5, 2018 - link
Hey Ganesh, can you comment on the current status of apparent lack of iGPU/AMD-CPU switchable graphics? Is this just an early BIOS/software issue or an unfixable design flaw where video-out is forced to route through the power-sucking Vega chip? This may be tolerable on a NUC but would be totally unacceptable on a laptop.I have an XPS-15 2-in-1 (9575) on order having assumed that Dell would never release a laptop with such a glaring flaw. But now with the first review out (https://www.digitaltrends.com/laptop-reviews/dell-... saying battery life is really bad, I'm getting concerned. Three hours runtime? Really??
I thought this was the laptop I was waiting for but now I'm seriously considering canceling my order before it ships and holding off until the issue is sorted out or at least understood.
I assume Intel is aware of the issue - can they fix it or did they (intentionally or unintentionally) sabotage their own (AMD) product??
AllThings3D - Saturday, April 7, 2018 - link
I noticed you only benchmarked the faster and more expensive NUC8i7HVK. Do you have any plans to benchmark the NUC8i7HNK? I have found very little on this unit and would love to know how much less is expected in performance. If we can obtain at least 50% over the equivalent KabyLake NUC with Iris 620 Graphics, this would be okay for my needs especially since the TDP is 65W versus 100W for the NUC8i7HVK. My purpose is to use this Microsoft Mixed Reality backpack PC with two Sony V-Lock or AntonBauer battery packs. My current NUC "belt system" using the Iris 620 IGPU has worked out very well for doing engineering and architectural VR visualization and with the MSXR using an unbounded positional tracking system, you can navigate larger spaces than with the current HTC/Vive systems. In this YouTube video (https://youtu.be/hM8uwzmhaJY) I am in my backyard, something I don't think I have seen done with the any of the other VR solution :)One more questions. Do you know what the actual VDC in range is? I know previous NUCs had an actual range between 11-24 VDC. Since the 'Belt System' uses a KabyLake NUC, the 14.8 VDC AntonBauer LiPo works great. I hope this is the case here since it would complicate my battery circuit to have have to go with a custom solution.
JKJK - Tuesday, April 10, 2018 - link
So... As a future proof media center (mostly kodi use), should I buy the previous gen?Need answer asap if I need to cancel my order