The Western Digital WD Black 3D NAND SSD Review: EVO Meets Its Match
by Ganesh T S & Billy Tallis on April 5, 2018 9:45 AM EST- Posted in
- SSDs
- Storage
- Western Digital
- SanDisk
- NVMe
- Extreme Pro
- WD Black
Mixed Random Performance
Our test of mixed random reads and writes covers mixes varying from pure reads to pure writes at 10% increments. Each mix is tested for up to 1 minute or 32GB of data transferred. The test is conducted with a queue depth of 4, and is limited to a 64GB span of the drive. In between each mix, the drive is given idle time of up to one minute so that the overall duty cycle is 50%.
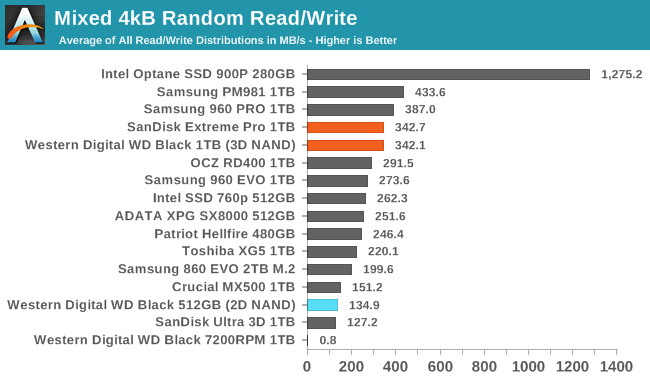
The WD Black offers great mixed random I/O performance, but it is still slightly slower overall than the best drives from Samsung, and the Optane SSD is in an entirely different league.
 |
|||||||||
| Power Efficiency in MB/s/W | Average Power in W | ||||||||
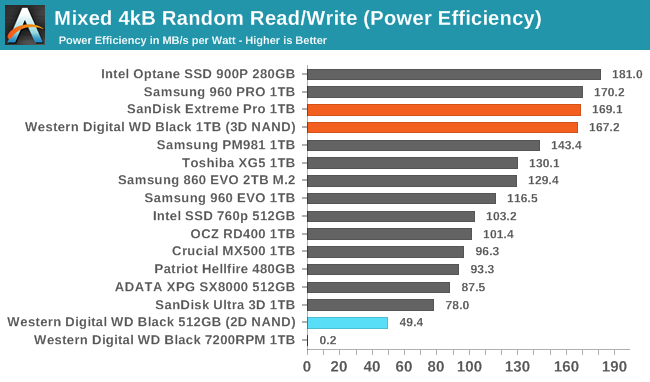
The WD Black's power efficiency on the mixed random I/O test is about the same as that of the Samsung 960 PRO, and close to the Optane SSD in spite of the vast difference in absolute performance level.
 |
|||||||||
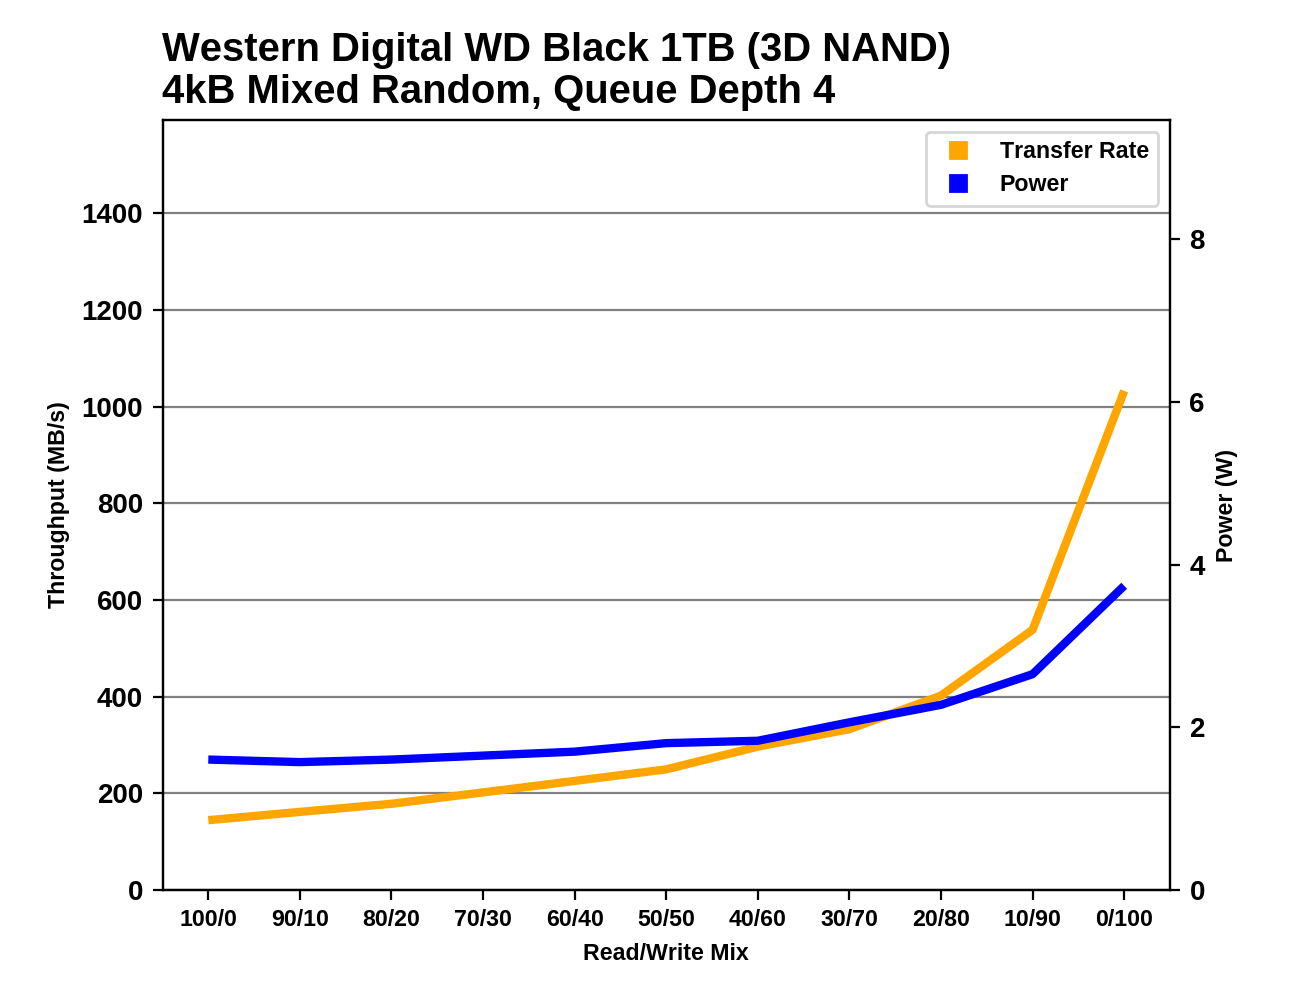
The performance of the WD Black grows very slowly as the workload shifts from reads toward writes, but near the end of the test the good SLC write caching implementation gives the WD Black steep gains. Power consumption is under 2W for most of the test and doesn't quite reach 4W at the very end.
Mixed Sequential Performance
Our test of mixed sequential reads and writes differs from the mixed random I/O test by performing 128kB sequential accesses rather than 4kB accesses at random locations, and the sequential test is conducted at queue depth 1. The range of mixes tested is the same, and the timing and limits on data transfers are also the same as above.
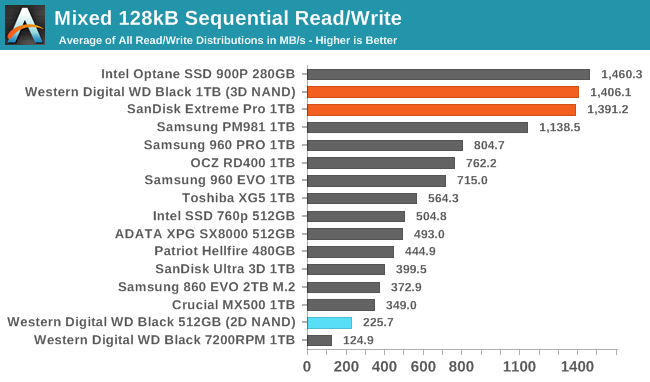
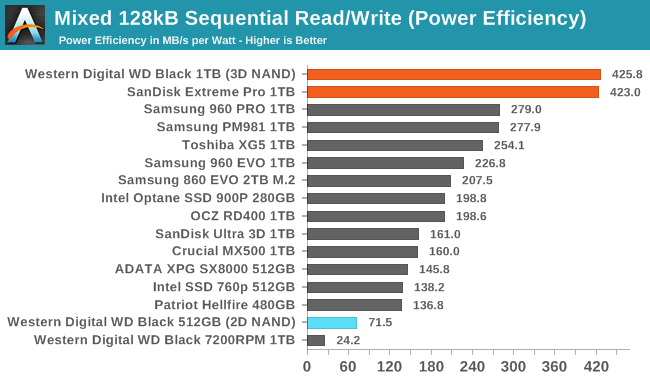
The mixed sequential workload performance of the WD Black is surprisingly good, just barely behind the Optane SSD and far ahead of almost all flash-based SSDs.
 |
|||||||||
| Power Efficiency in MB/s/W | Average Power in W | ||||||||
The WD Black draws about the same power as other SSDs during the mixed sequential test, and combined with the great performance that translates to a huge lead in power efficiency.
 |
|||||||||
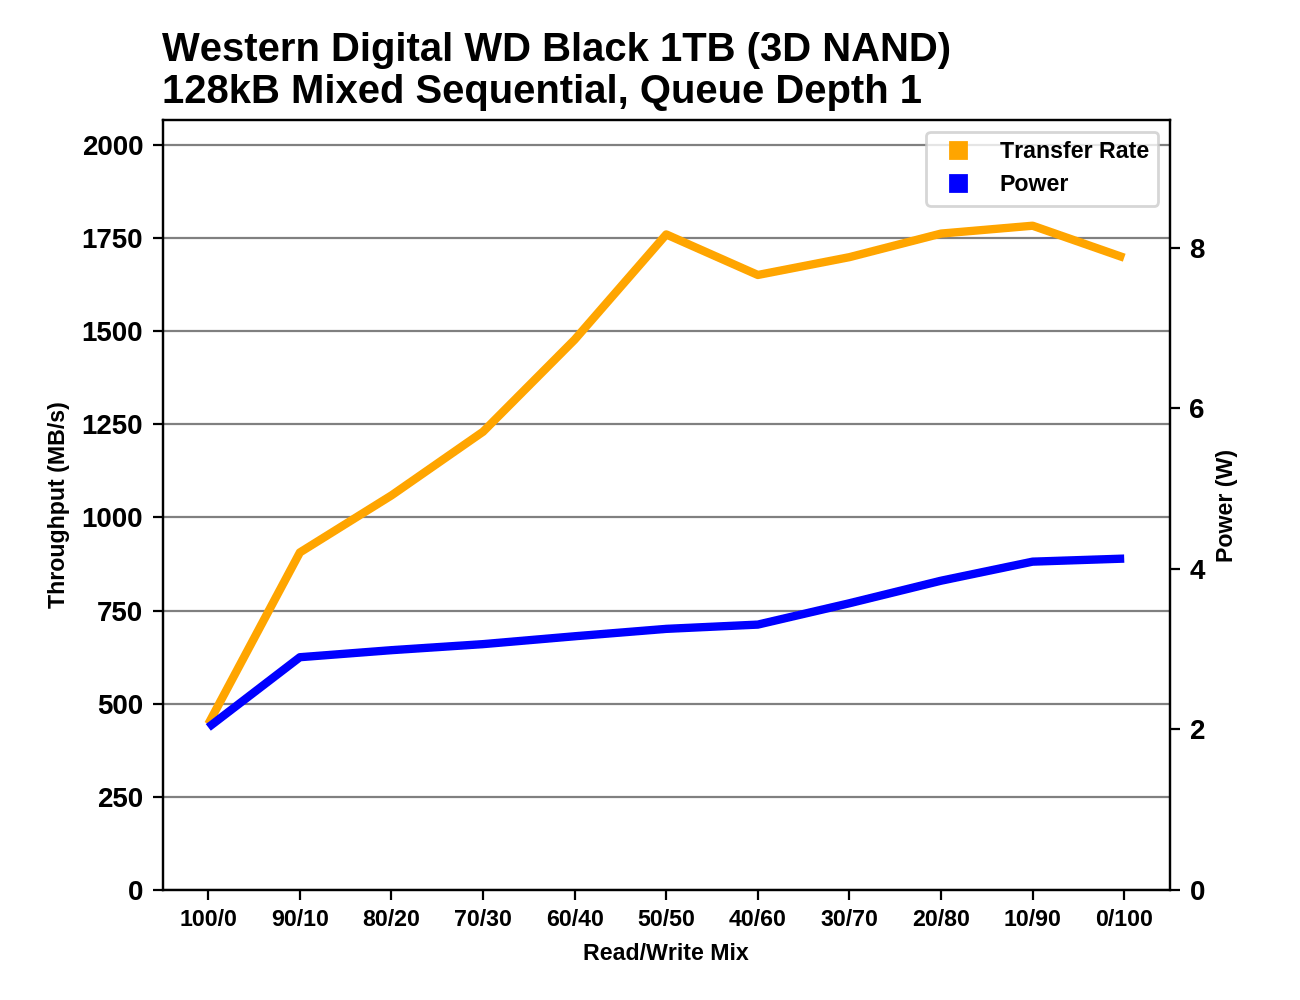
The performance scaling pattern of the WD Black on the mixed sequential test is quite unusual. Many drives show a bathtub curve with peak performance at either end of the test when the workload is pure reads or pure writes, and the worst performance in the middle of the test. By contrast, the WD Black starts out rather slowly but rapidly speeds up during the first half of the test, and stays near full performance for the entire second half.


69 Comments
View All Comments
MajGenRelativity - Thursday, April 12, 2018 - link
Higher capacities can be made available at 2280 by using a double sided drive. As for IOPS performance, that can be calculated fairly easily, and I *think* Anandtech does that (I haven't read this review recently). I'm not sure what you mean about the drivers, or "Warranty period directly calculated based on the Endurance fures"oRAirwolf - Friday, April 13, 2018 - link
I would really love it if Anandtech had some common usage scenario load times for things like a large spreadsheet in Excel or how fast some modern games load. I would also be interested to know about things like Windows load time and time to wake up from sleep or hibernation. From what I have seen, all of these super fast nvme ssds don't really have a lot of impact on typical end-user usage scenarios like for office workers or gamers. I love bleeding edge tech and I always want manufacturers to push the limits of price and performance but it seems to me like a lot of people get wrapped around the axles about SSD performance when something like an 850 Evo and a 960 Pro will have almost identical load times in a game.