The Western Digital WD Black 3D NAND SSD Review: EVO Meets Its Match
by Ganesh T S & Billy Tallis on April 5, 2018 9:45 AM EST- Posted in
- SSDs
- Storage
- Western Digital
- SanDisk
- NVMe
- Extreme Pro
- WD Black
Mixed Random Performance
Our test of mixed random reads and writes covers mixes varying from pure reads to pure writes at 10% increments. Each mix is tested for up to 1 minute or 32GB of data transferred. The test is conducted with a queue depth of 4, and is limited to a 64GB span of the drive. In between each mix, the drive is given idle time of up to one minute so that the overall duty cycle is 50%.
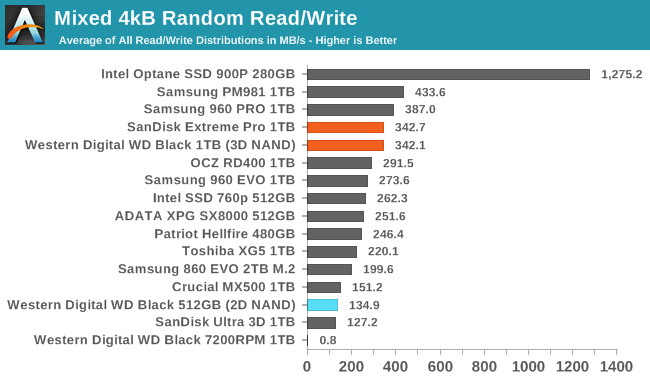
The WD Black offers great mixed random I/O performance, but it is still slightly slower overall than the best drives from Samsung, and the Optane SSD is in an entirely different league.
 |
|||||||||
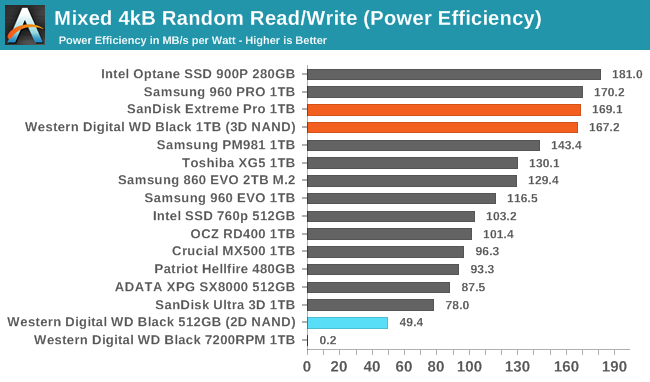
| Power Efficiency in MB/s/W | Average Power in W | ||||||||
The WD Black's power efficiency on the mixed random I/O test is about the same as that of the Samsung 960 PRO, and close to the Optane SSD in spite of the vast difference in absolute performance level.
 |
|||||||||
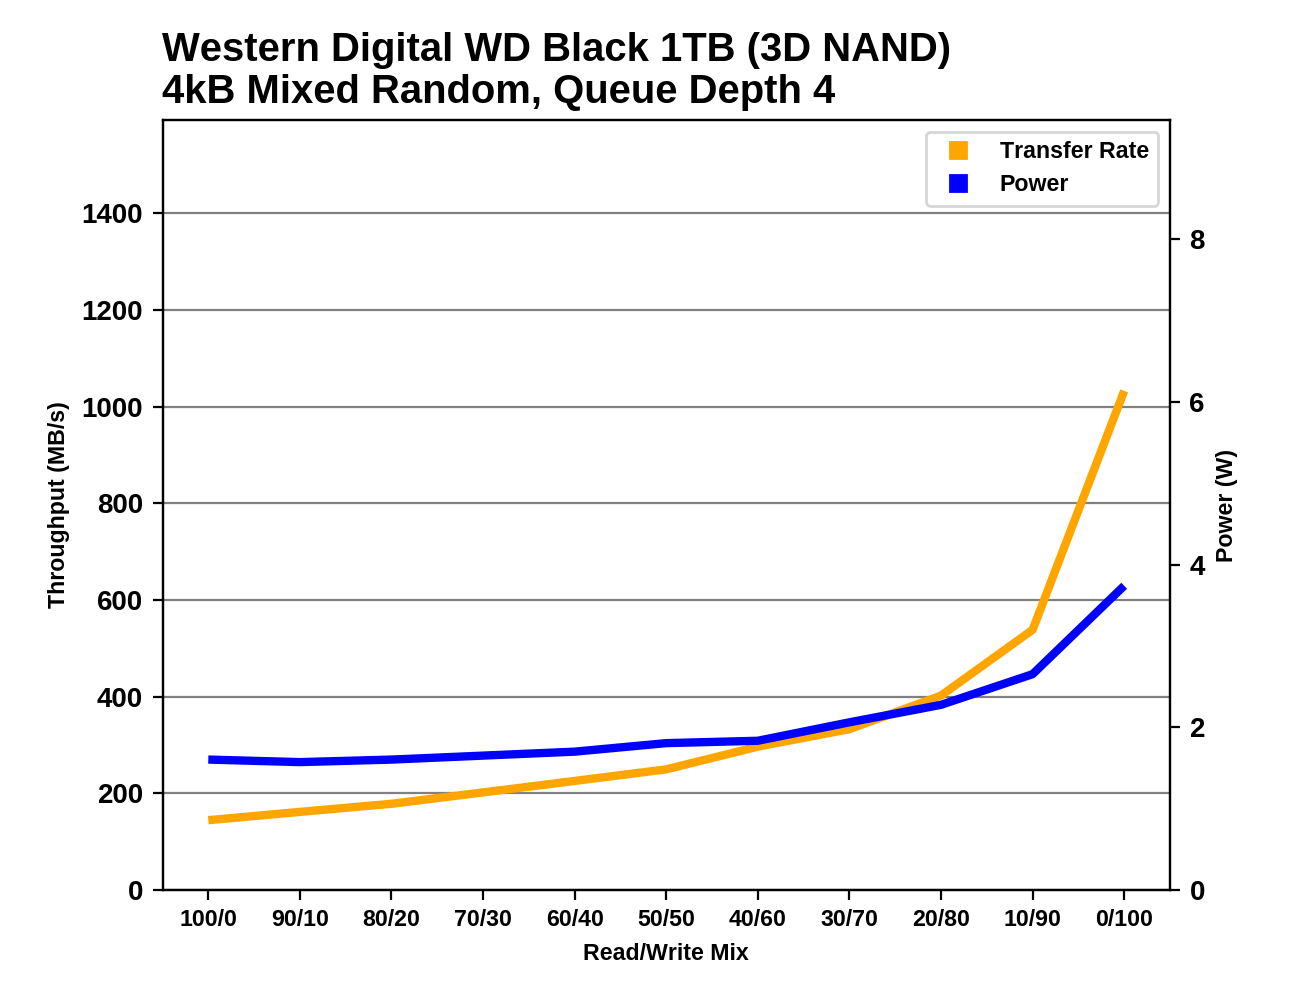
The performance of the WD Black grows very slowly as the workload shifts from reads toward writes, but near the end of the test the good SLC write caching implementation gives the WD Black steep gains. Power consumption is under 2W for most of the test and doesn't quite reach 4W at the very end.
Mixed Sequential Performance
Our test of mixed sequential reads and writes differs from the mixed random I/O test by performing 128kB sequential accesses rather than 4kB accesses at random locations, and the sequential test is conducted at queue depth 1. The range of mixes tested is the same, and the timing and limits on data transfers are also the same as above.
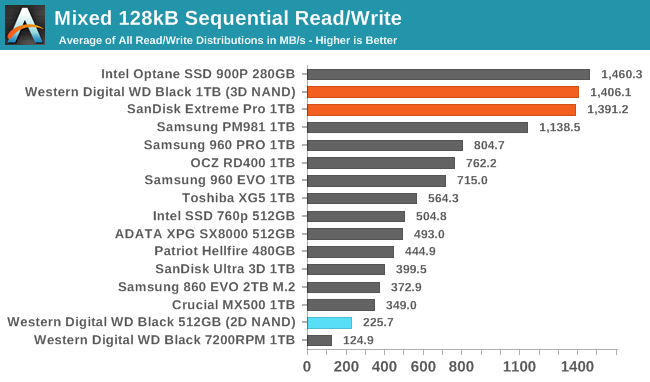
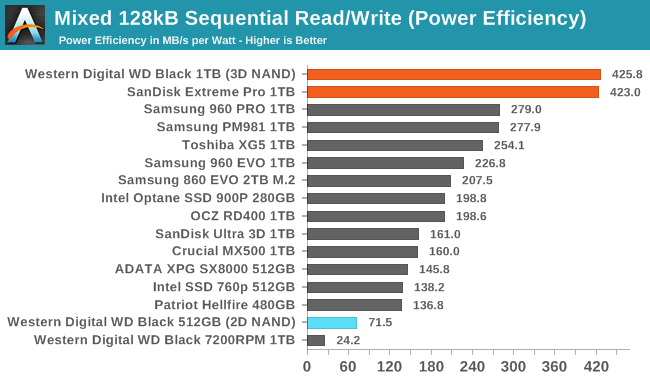
The mixed sequential workload performance of the WD Black is surprisingly good, just barely behind the Optane SSD and far ahead of almost all flash-based SSDs.
 |
|||||||||
| Power Efficiency in MB/s/W | Average Power in W | ||||||||
The WD Black draws about the same power as other SSDs during the mixed sequential test, and combined with the great performance that translates to a huge lead in power efficiency.
 |
|||||||||
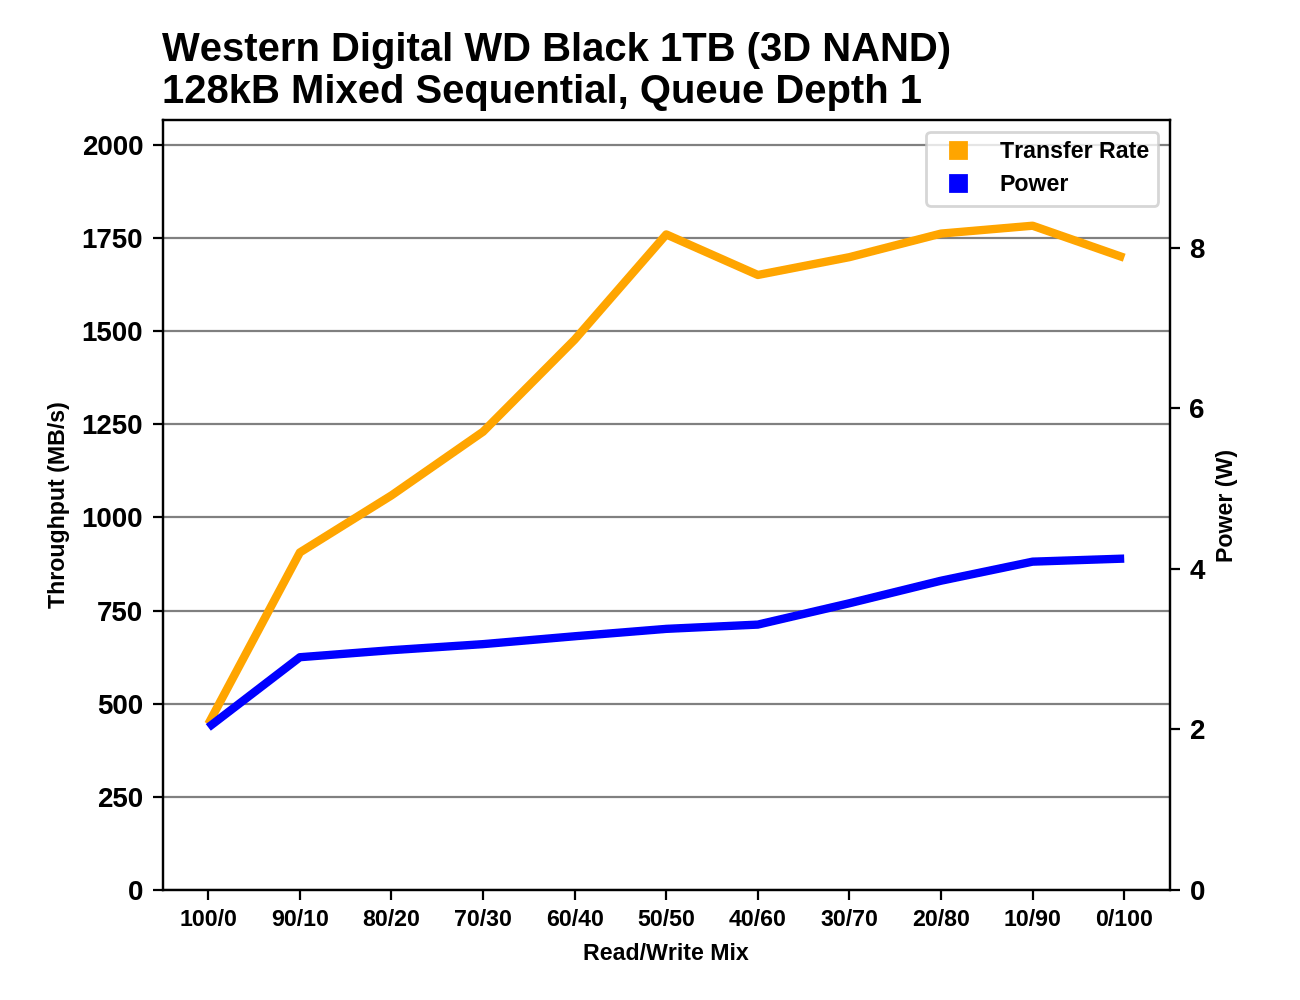
The performance scaling pattern of the WD Black on the mixed sequential test is quite unusual. Many drives show a bathtub curve with peak performance at either end of the test when the workload is pure reads or pure writes, and the worst performance in the middle of the test. By contrast, the WD Black starts out rather slowly but rapidly speeds up during the first half of the test, and stays near full performance for the entire second half.


69 Comments
View All Comments
boeush - Thursday, April 5, 2018 - link
You're going a bit overboard here with the paranoia.The ATSB Heavy and Light tests are designed to represent performance under normal use by power-wistful and typical consumers, respectively. So if you actually care about real-world performance, those results are enough. (And arguably, even the (ab)use as an Enterprise drive scenario, is largely addressed by the ATSB Destroyer test.)
FreckledTrout - Thursday, April 5, 2018 - link
Agree boeush, ihe QD32 that was omitted really just makes some drives look like they are higher performing but in 99+% use cases that is misleading since its very hard to hit a queue depth of 32 in desktop usage.MrSpadge - Friday, April 6, 2018 - link
+1 @ boeush (just posting for your statistics, iter)Reflex - Thursday, April 5, 2018 - link
Nobody on this site works for you, you don't get to define their job.DanD85 - Thursday, April 5, 2018 - link
Such arrogant attitude! Did you pay Anandtech's staff well enough to make such demand? If you don't find what you seek here, feel free to go elsewhere.Manch - Friday, April 6, 2018 - link
I don't care about the test. There. Along with the rest telling you to STFU your request statistically speaking is of little interest.Don't let the back button hit you on the way out, you ass.
Spunjji - Friday, April 6, 2018 - link
You're not his boss. Go home.FwFred - Friday, April 6, 2018 - link
It would be useful for me for an article which steps back and looks at various storage technologies (new and old) and measure their impact on consumer usages.For example, how much would I gain from upgrading my ancient 840 EVO to a new NVME drive or even Optane.
msabercr - Friday, April 20, 2018 - link
99th percentile results are performance consistency testing.Although, that's typically only important in DC devices which are typically not made in m.2 form factors.
jjj - Thursday, April 5, 2018 - link
Good that perf is ok, especially after last year's model but the price is no fun. do we still need an 80% premium over mainstream SATA?