Intel Optane SSD DC P4800X 750GB Hands-On Review
by Billy Tallis on November 9, 2017 12:00 PM ESTSingle-Threaded Performance
This next batch of tests measures how much performance can be driven by a single thread performing asynchronous I/O to produce queue depths ranging from 1 to 64. With these fast SSDs, the CPU can become the bottleneck at high queue depths and clock speed can have a major impact on IOPS.
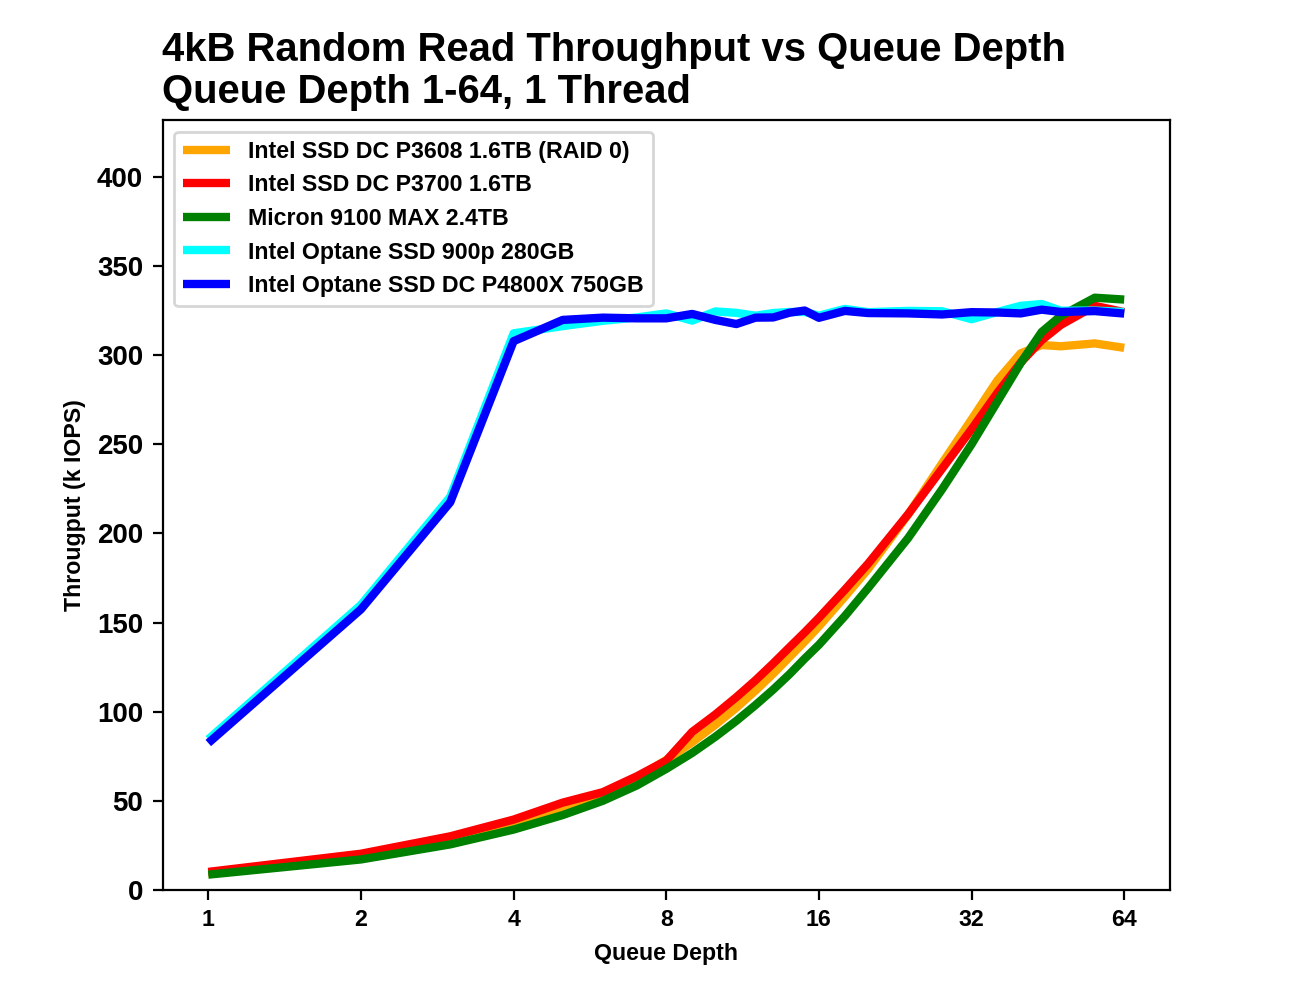
4kB Random Reads
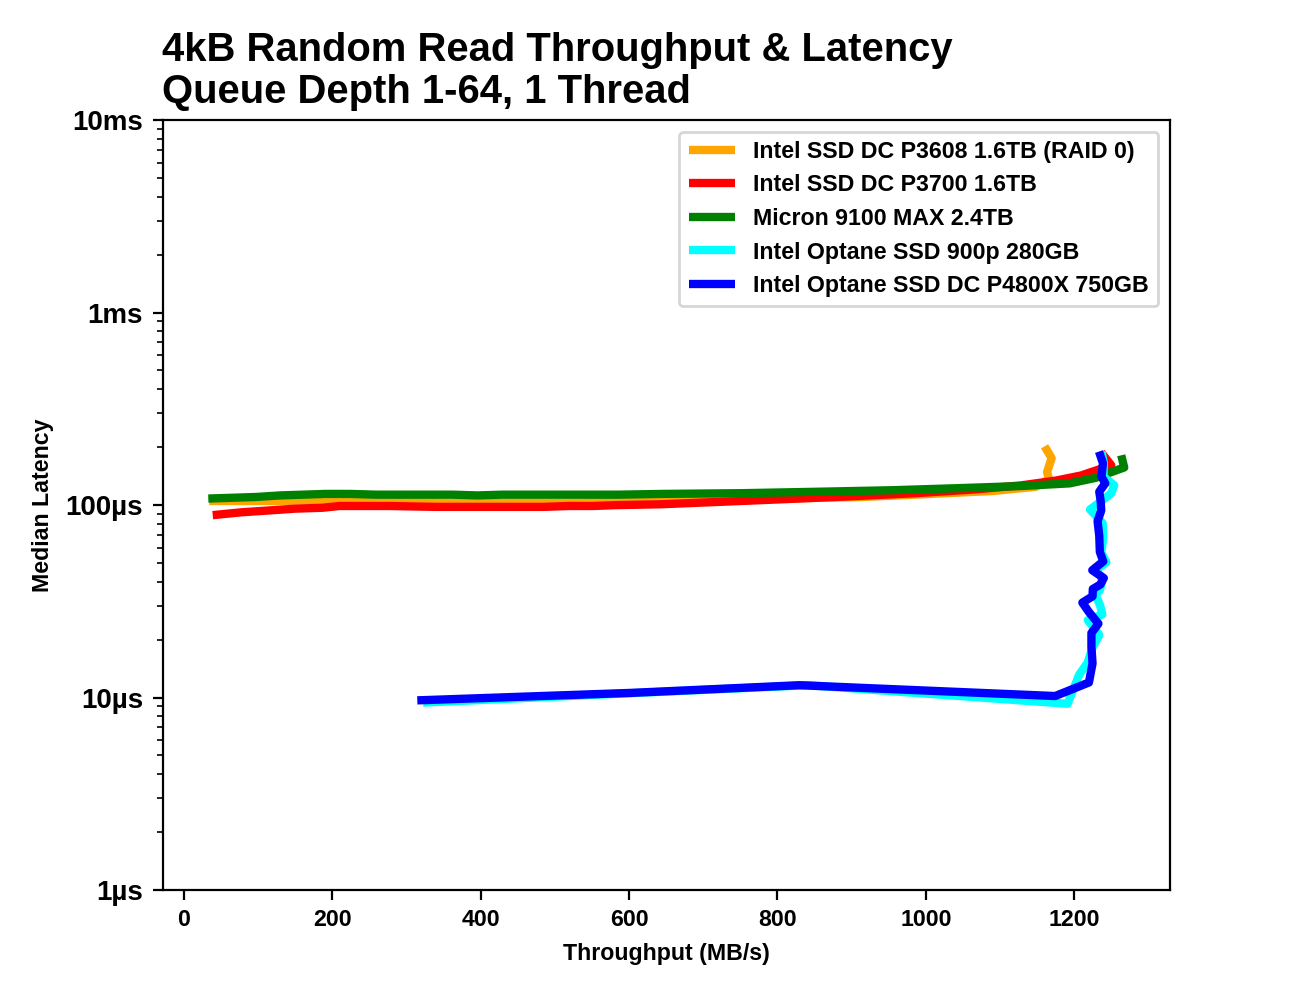
With a single thread issuing asynchronous requests, all of the SSDs top out around 1.2GB/s for random reads. What separates them is how high a queue depth is necessary to reach this level of performance, and what their latency is when they first reach saturation.
 |
|||||||||
| Throughput: | IOPS | MB/s | |||||||
| Latency: | Mean | Median | 99th Percentile | 99.999th Percentile | |||||
For the Optane SSDs, the queue depth only needs to reach 4-6 in order to be near the highest attainable random read performance, and further increases in queue depth only add to the latency without improving throughput. The flash-based SSDs require queue depths well in excess of 32. Even long after the Optane SSDs have reached saturation an latency has begun to climb, the Optane SSDs continue to offer better QoS than the flash SSDs.
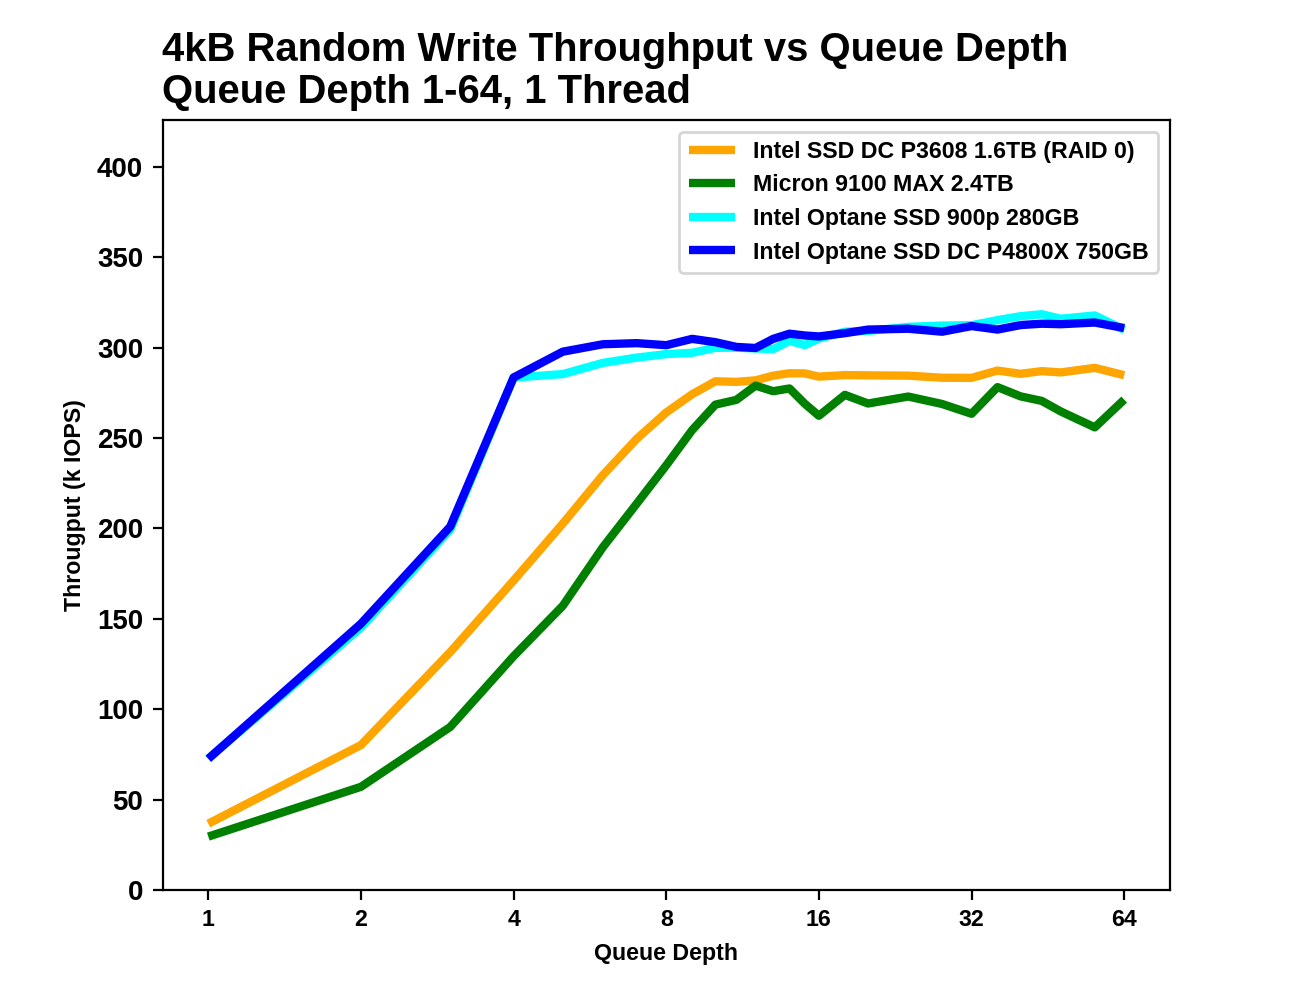
4kB Random Writes
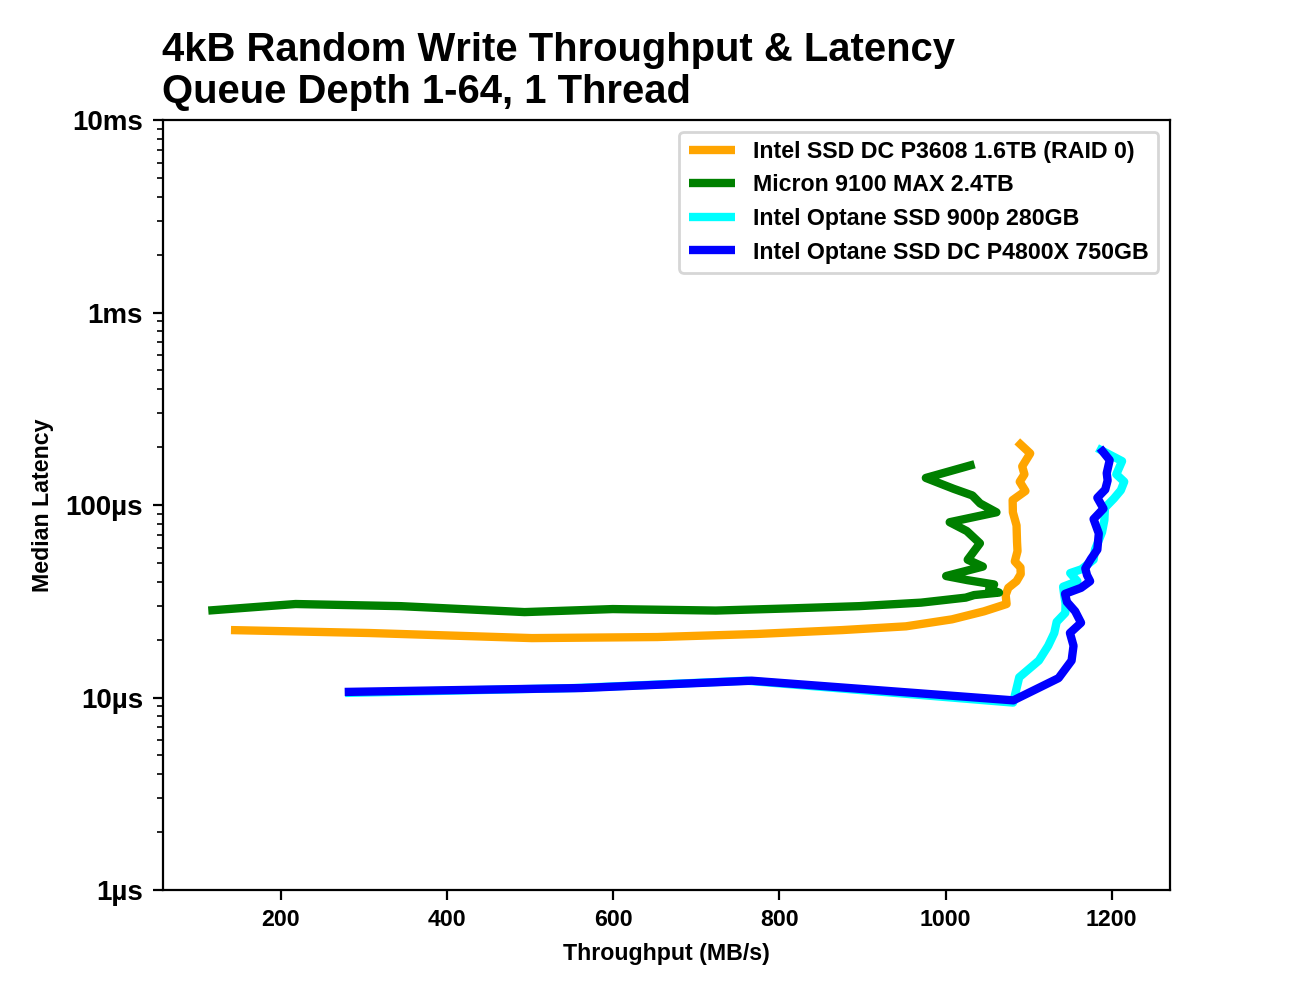
The Optane SSDs offer the best single-threaded random write performance, but the margins are much smaller than for random reads, thanks to the write caches on the flash-based SSDs. The flash SSDs have random write latencies that are only 2-3x higher than the Optane SSD's latency, and the throughput advantage of the Optane SSD at saturation is less than 20%.
 |
|||||||||
| Throughput: | IOPS | MB/s | |||||||
| Latency: | Mean | Median | 99th Percentile | 99.999th Percentile | |||||
The Optane SSDs saturate around QD4 where the CPU becomes the bottleneck, and the flash based SSDs follow suit between QD8 and QD16. Once all the drives are saturated at about the same throughput, the Optane SSDs offer far more consistent performance.
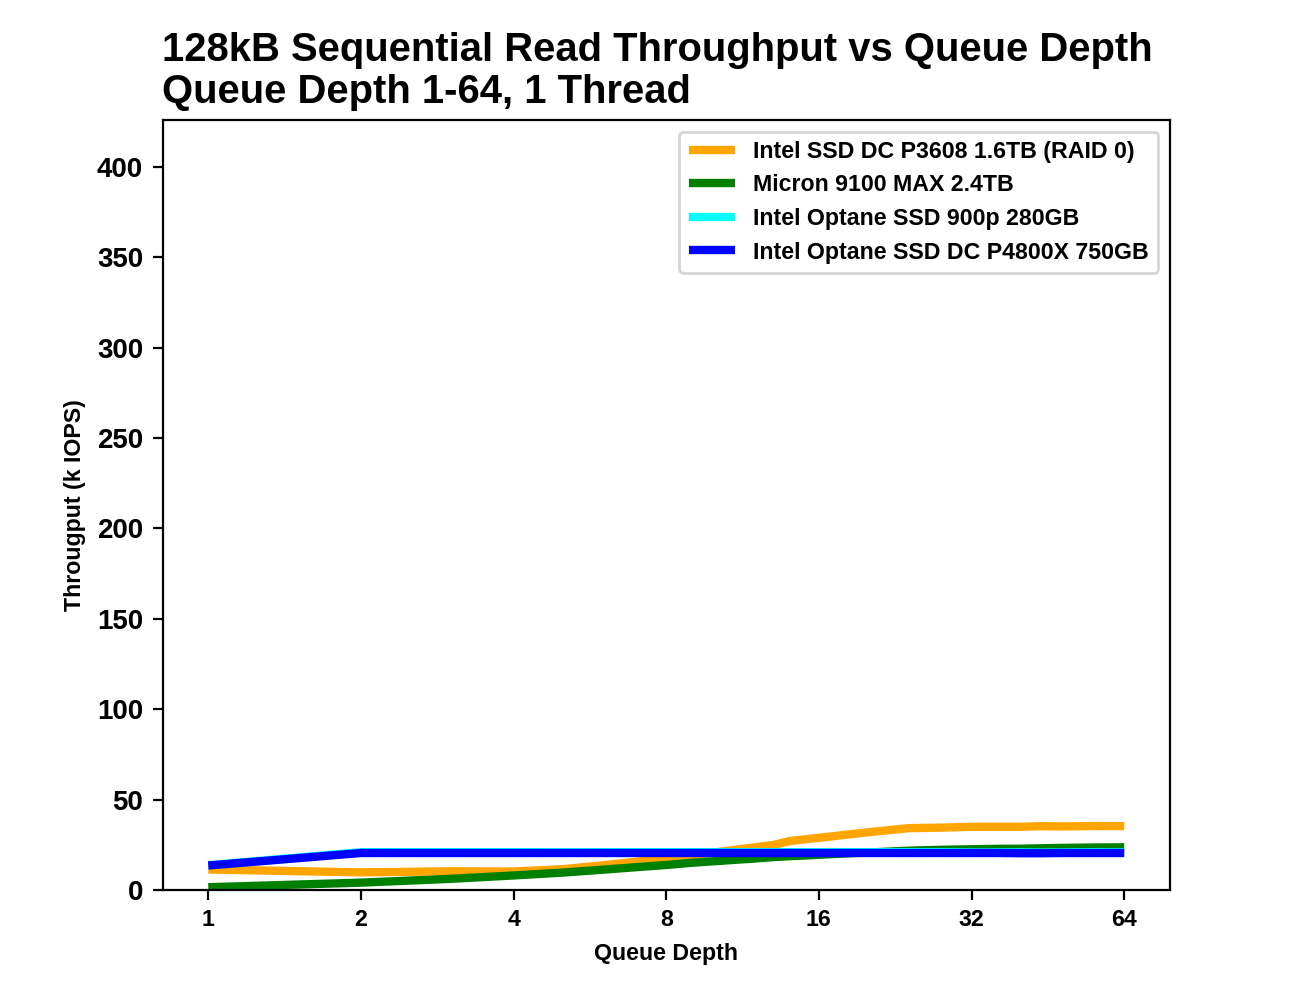
128kB Sequential Reads
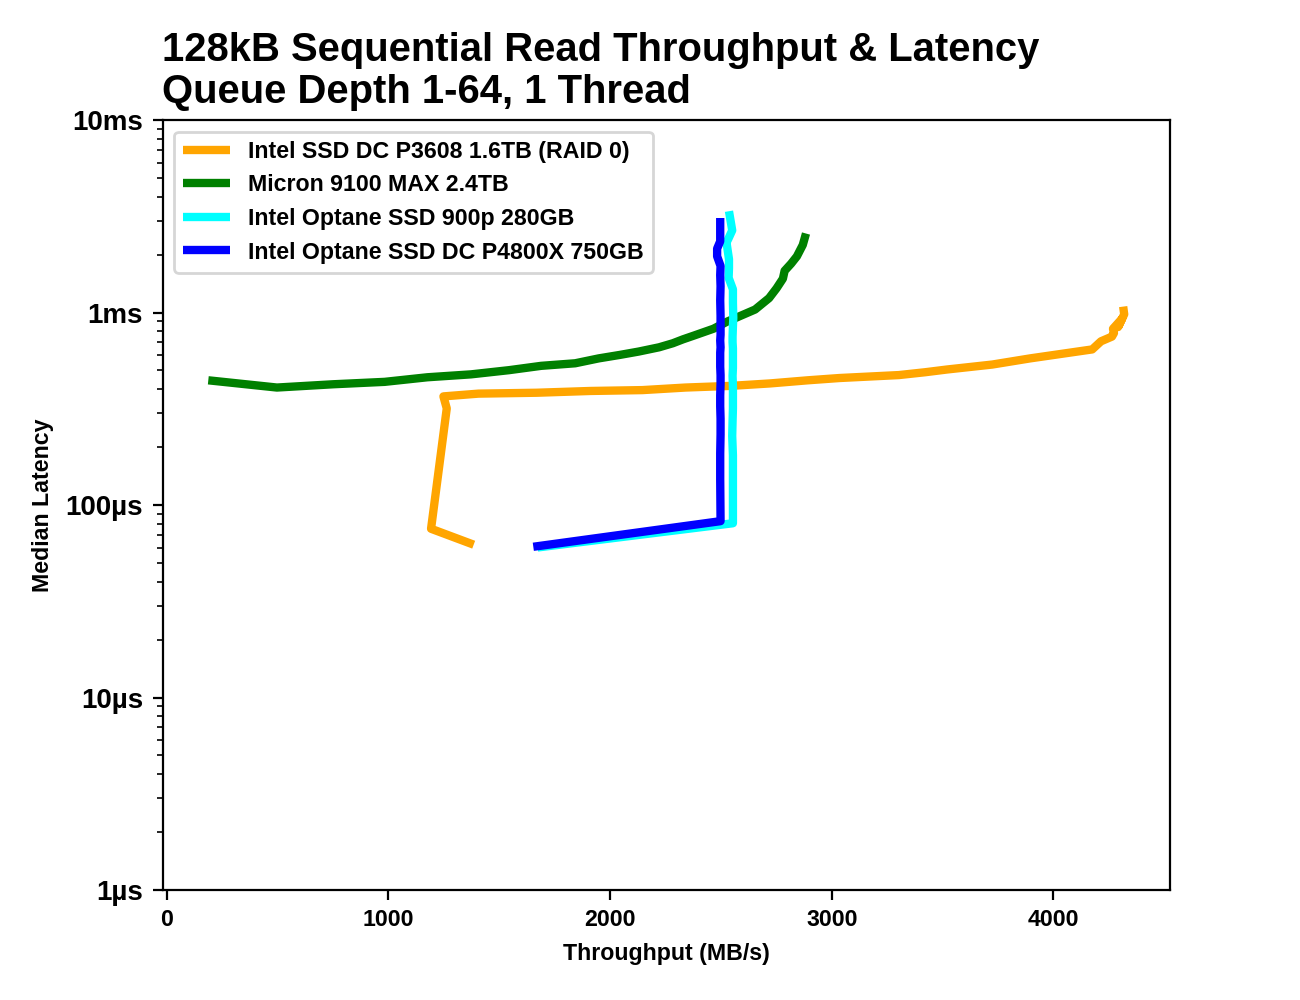
With the large 128kB block size, the sequential read test doesn't hit a CPU/IOPS bottleneck like the random read test above. The Optane SSDs saturate at the rated throughput of about 2.4-2.5GB/s while the Micron 9100 MAX and the Intel P3608 scale to higher throughput.
 |
|||||||||
| Throughput: | IOPS | MB/s | |||||||
| Latency: | Mean | Median | 99th Percentile | 99.999th Percentile | |||||
The Optane SSDs reach their full sequential read speed at QD2, and the flash-based SSDs don't catch up until well after QD8. The 99th and 99.999th percentile latencies of the Optane SSDs are more than an order of magnitude lower when the drives are operating at their respective saturation points.
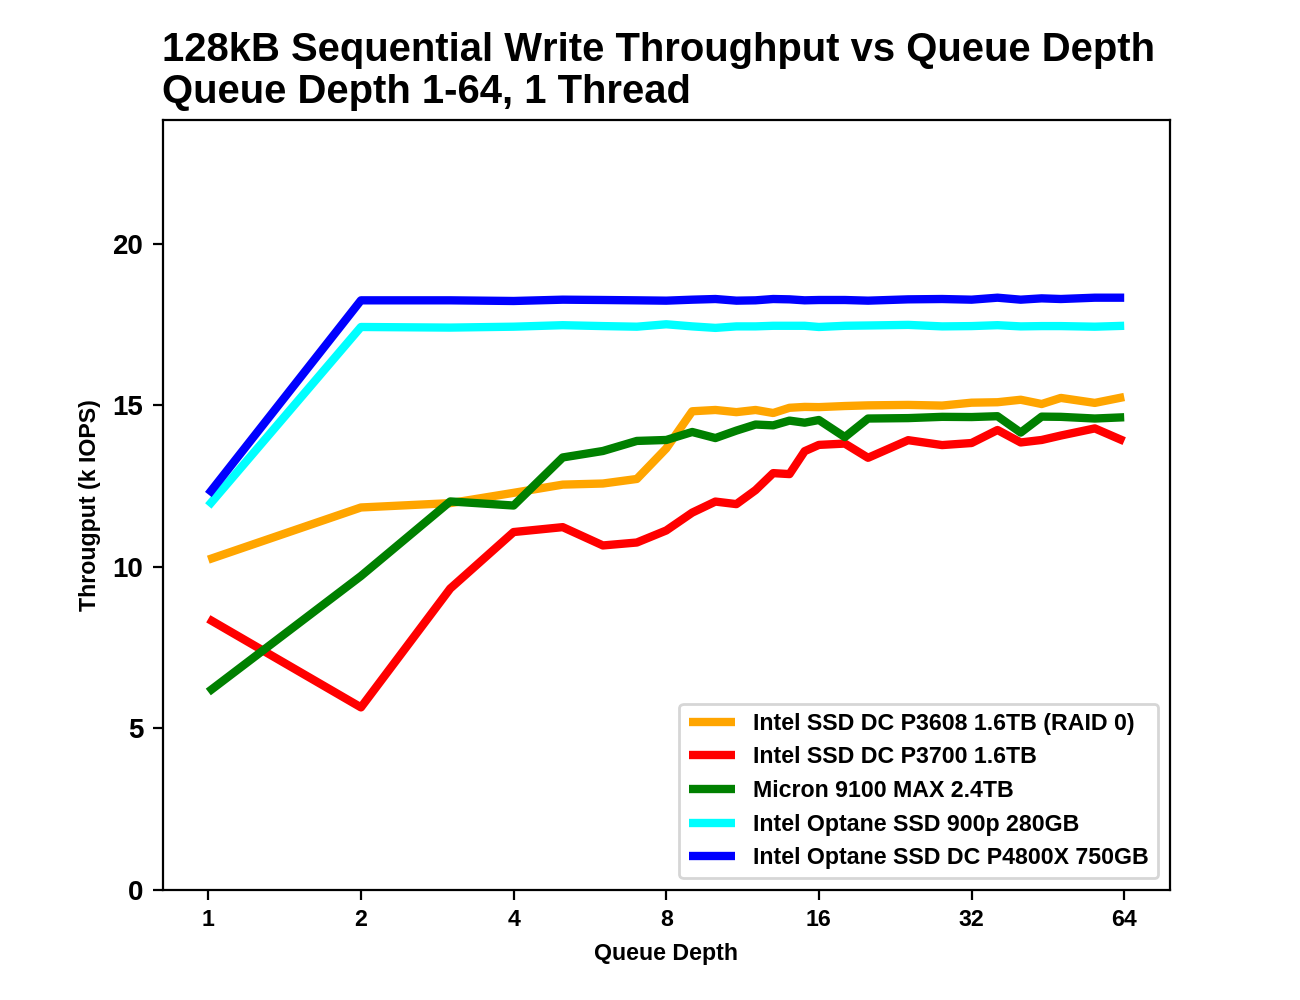
128kB Sequential Writes
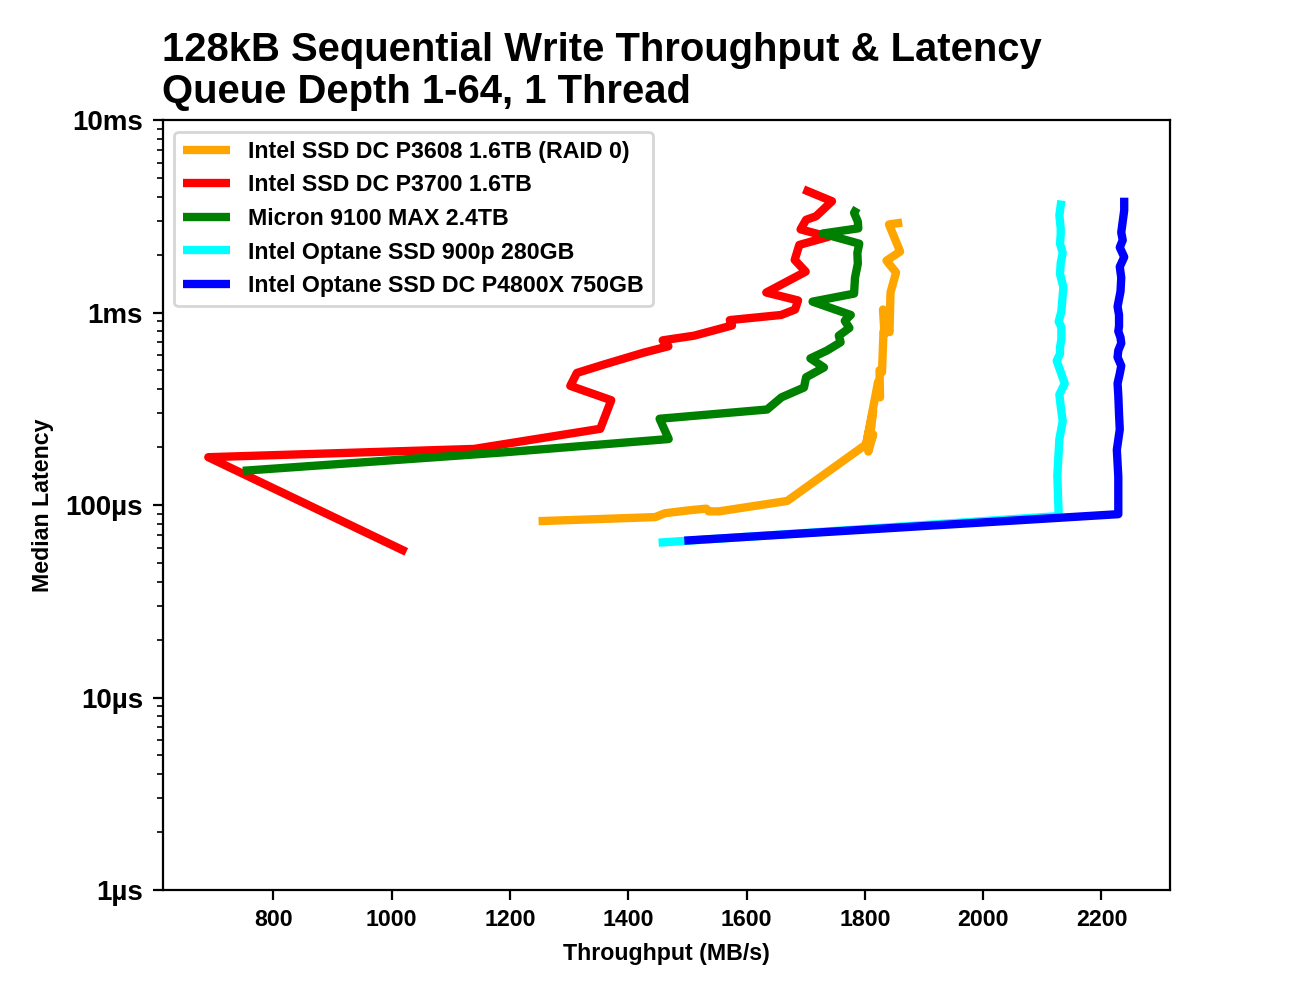
Write caches again allow the flash-based SSDs to approach the write latency of the Optane SSDs, albeit at lower throughput. The Optane SSDs quickly exceed their specified 2GB/s sequential write throughput while the flash-based SSDs have to sacrifice low latency in order to reach high throughput.
 |
|||||||||
| Throughput: | IOPS | MB/s | |||||||
| Latency: | Mean | Median | 99th Percentile | 99.999th Percentile | |||||
As with sequential reads, the Optane SSDs reach saturation at a mere QD2, while the flash-based SSDs need until around QD8 to scale up to full throughput. By the time the flash-based SSDs reach their maximum speed, their latency has at least doubled.


58 Comments
View All Comments
tuxRoller - Friday, November 10, 2017 - link
Since this is for enterprise, the os vendor would be the one responsible (so, yes, third party) and one of the reasons why you pay them ridiculous support fees is for them to be your single point of contact for most issues.tuxRoller - Friday, November 10, 2017 - link
Very nice write-up.Might it be possible for us to get an idea of the difference in cell access times by running a couple tests on a loop device, and, even better, purely dram-based storage accessed over pcie?
Pork@III - Friday, November 10, 2017 - link
Has no normal only speed test? What are these creepy creations of this vc that?romrunning - Friday, November 10, 2017 - link
Is there any tests of the 4800X in a virtual host? Either Hyper-V or ESX, running multiple server OS clients with a variety of workloads. With the kind of low latency shown, I'd love to see how much more responsive Optane is compared to all flash storage like a P3608. Sort of a" rising tide floats all ships" kind of improvement, I hope.Klimax - Sunday, November 12, 2017 - link
That's nice review. How about some test using Windows too. (Aka something with more advanced I/O subsystem)Billy Tallis - Monday, November 13, 2017 - link
I'm not sure what you mean. Nobody seriously considers the Windows I/O system to be more advanced than what Linux provides. Even Intel's documentation states that the best latency they can get out of the Optane SSD on Windows is a few microseconds slower than on the Linux NVMe driver, and on Linux a few more microseconds can be saved using SPDK.tuxRoller - Tuesday, November 14, 2017 - link
"Advanced" may be the wrong way to look at it because ntkrnl can perform both sync and async operations, while Linux is essentially a sync-based kernel (the limitations surrounding its aio system are legendary). However, by focusing on doing that one thing well the block subsystem has become highly optimized for enterprise workloads.Btw, is there any chance you could run that block system (and nvme protocol, if possible) overhead test i asked about?