The Intel SSD 545s (512GB) Review: 64-Layer 3D TLC NAND Hits Retail
by Billy Tallis on June 27, 2017 6:00 AM ESTBAPCo SYSmark 2014 SE
BAPCo's SYSmark 2014 SE is an application-based benchmark that uses real-world applications to replay usage patterns of business users in the areas of office productivity, media creation and data/financial analysis. In addition, it also addresses the responsiveness aspect which deals with user experience as related to application and file launches, multi-tasking etc. Scores are calibrated against a reference system that is defined to score 1000 in each of the scenarios. A score of, say, 2000, would imply that the system under test is twice as fast as the reference system.
SYSmark scores are based on total application response time as seen by the user, including not only storage latency but time spent by the processor. This means there's a limit to how much a storage improvement could possibly increase scores, because the SSD is only in use for a small fraction of the total test duration. This is a significant difference from our ATSB tests where only the storage portion of the workload is replicated and disk idle times are cut short to a maximum of 25ms.
| AnandTech SYSmark SSD Testbed | |
| CPU | Intel Core i5-7400 |
| Motherboard | ASUS B250-PLUS |
| Chipset | Intel B250 |
| Memory | 2x 8GB Kingston DDR4-2400 CL17 |
| Case | In Win C583 |
| Power Supply | Cooler Master G550M |
| OS | Windows 10 64-bit, version 1703 |
Our SSD testing with SYSmark uses a different test system than the rest of our SSD tests. This machine is set up to measure total system power consumption rather than just the drive's power.
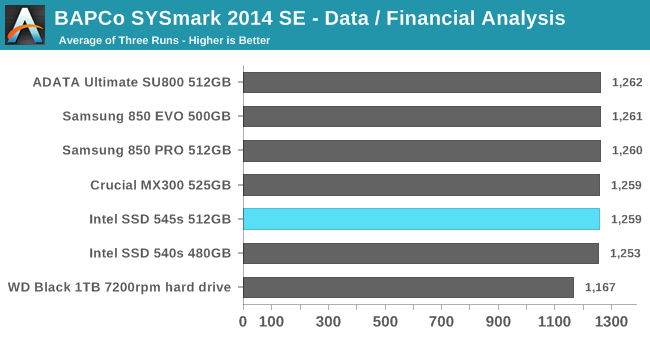
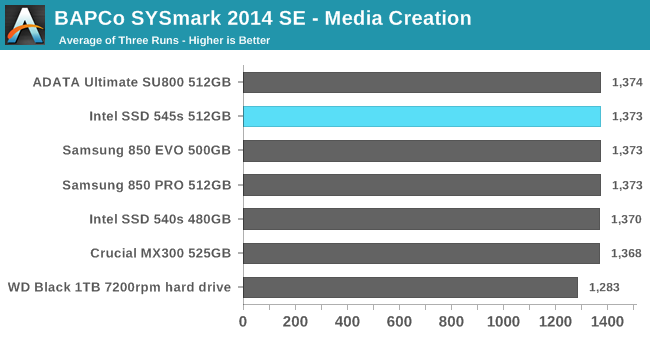
The SYSmark performance scores for data analysis and media creation are relatively insensitive to storage performance, as shown by our test system's score with a mechanical hard drive exceeding the normalized score of 1000 for the SYSmark reference system that uses a SSD and coming relatively close to the performance of our SSDs. The differences between these SATA SSDs are all within the variation between runs.

The office productivity test also shows very little dependence on storage performance, but the gap between the SSDs and the hard drive is a bit wider than for the first two usage scenarios, and the hard drive's detrimental impact on performance was enough to offset the CPU and RAM advantages our testbed has relative to the SYSmark 2014 SE reference system.
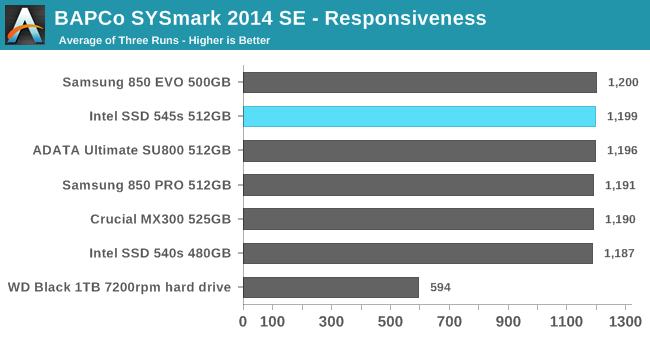
The SYSmark responsiveness benchmark is the most sensitive to storage performance, and all of the SATA SSDs are about twice as fast as the mechanical hard drive. The difference between SSDs is just barely larger than the variation between test runs, but it's enough that the slowest of the three runs for the 545s was faster than the fastest of the three runs for the Intel 540s.
Energy Usage
The SYSmark energy usage scores measure total system power consumption, excluding the display. Our SYSmark test system idles at around 26 W and peaks at over 60 W measured at the wall during the benchmark run. SATA SSDs seldom exceed 5 W and idle at a fraction of a watt, and the SSDs spend most of the test idle. This means the energy usage scores will inevitably be very close. A typical notebook system will tend to be better optimized for power efficiency than this desktop system, so the SSD would account for a much larger portion of the total and the score difference between SSDs would be more noticeable.
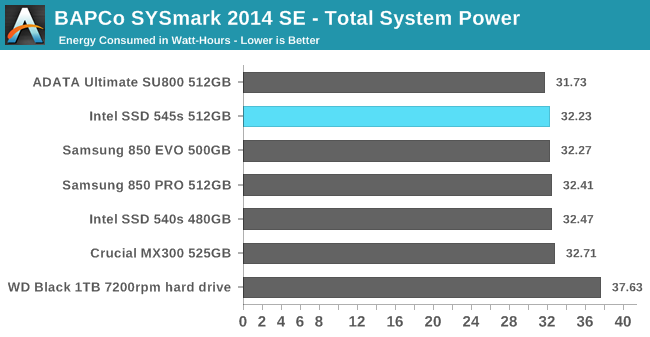
Rather than judging these scores by their percentage difference, it's probably more useful to consider the raw number of Watt-hours saved by using a more efficient SSD. The difference here between the best and worst SSD is just under 1 Wh, compared to a typical ultrabook battery capacity of around 50 Wh. Since the overall performance scores with each SSD were so close together, we know that the test runs took essentially the same amount of time and the differences in energy usage are due mostly to differences in the idle power consumption of the SSDs.


74 Comments
View All Comments
cybertec69 - Tuesday, June 27, 2017 - link
There is no NANDI shortage, it's all a bunch of nonsense, it's nothing more than price gouging.patrickjp93 - Wednesday, June 28, 2017 - link
Yes there is. Factories are converting all of their equipment from planar to 3D. It takes time just to move everything, then tune yields, and boost to mass production. On top of that, NAND demand has doubled in the past 2 years. There is a very real shortage.AnTech - Wednesday, June 28, 2017 - link
How does it compare to the current gold standard (Samsung Portable SSD T3)?Samsung Portable SSD T3 is so amazing that keeps cold even when booting Mac and working from it all day long. Really remarkable and amazing!
BTW, bring much larger sizes of 4 TB and more! And much cheaper prices!
Hurr Durr - Wednesday, June 28, 2017 - link
>portable ssd>gold standard
In what, waiting for the file transfer to finish?
mayankleoboy1 - Wednesday, June 28, 2017 - link
Regarding the "Random read performance" metric as outlined in http://www.anandtech.com/show/9009/ocz-vector-180-...Do you think it makes more sense to give 50%:37.5:12.5% weights to QD1:QD2:QD4 , instead of taking simple average?
Doubleslash - Wednesday, June 28, 2017 - link
Can you please do some meaningful IOPS, bandwidth and latency tests with fio or iozone? Things like sustained random 4k/8k/16k IOPS and large-block (64k/256k/512k/1024k) sequential read and write throughput are much better suited to compare wear-leveling, cache and controller performance.You can omit these SYSmark test as they are pretty useless. As the result indicates they do not stress the disk subsystem very much.
jardows2 - Wednesday, June 28, 2017 - link
Reviewing these charts, this product falls between the EVO and the MX300, but only slightly better than the MX300. It appears that the only realistic differences between the 545 and the MX300 are seen when the MX300 is full. Who uses their drives full? The current $20 price premium of the 545 over the MX300 doesn't seem worth it for the small gains, unless Intel can improve performance with some firmware updates.Wolfpup - Wednesday, June 28, 2017 - link
Wish companies would release MLC if not SLC drives too... Really not excited about being stuck with TLC.And I'm YEARS past caring about the performance of any of these drives, unless there's something weird about them. I care about reliability.
Hell, a few of my systems (not main systems, but still) boot if 5400RPM mechanical drives, and are fine. I really don't care if word launches in 0.0001 seconds or 0.0002 seconds or whatever LOL
piiman - Saturday, July 22, 2017 - link
"I really don't care if word launches in 0.0001 seconds or 0.0002 seconds or whatever LOL"Blasphemy!
alpha754293 - Thursday, June 29, 2017 - link
I look forward to seeing how it performs on the random write tests...I have four Intel 540 series 1 TB SSD drives at home and they're ok. I traded off speed for capacity and cost, and I didn't know that this was launching, so this was sort of a welcomed surprise.