The Intel Optane SSD DC P4800X (375GB) Review: Testing 3D XPoint Performance
by Billy Tallis on April 20, 2017 12:00 PM ESTSequential Read
Intel provides no specifications for sequential access performance of the Optane SSD DC P4800X. Buying an Optane SSD for a mostly sequential workload would make very little sense given that sufficiently large flash-based SSDs or RAID arrays can offer plenty of sequential throughput. Nonetheless, it will be interesting to see how much faster the Optane SSD is with sequential transfers instead of random access.
Sequential access is usually tested with 128kB transfers, but this is more of an industry convention and is not based on any workload trend as strong as the tendency for random I/Os to be 4kB. The point of picking a size like 128kB is to have transfers be large enough that they can be striped across multiple controller channels and still involve writing a full page or more to the flash on each channel. Real-world sequential transfer sizes vary widely depending on factors like which application is moving the data or how fragmented the filesystem is.
Even without a large native page size to its 3D XPoint memory, we expect the Optane SSD DC P4800X to exhibit good performance from larger transfers. A large transfer requires the controller to process fewer operations for the same amount of user data, and fewer operations means less protocol overhead on the wire. Based on the random access tests, it appears that the Optane SSD is internally managing the 3D XPoint memory in a way that greatly benefits from transfers being at least 4kB even though the drive emulates a 512B sector size out of the box.
The drives were preconditioned with two full writes using 4kB random writes, so the data on each drive is entirely fragmented. This may limit how much prefetching of user data the drives can perform on the sequential read tests, but they can likely benefit from better locality of access to their internal mapping tables.
Queue Depth 1
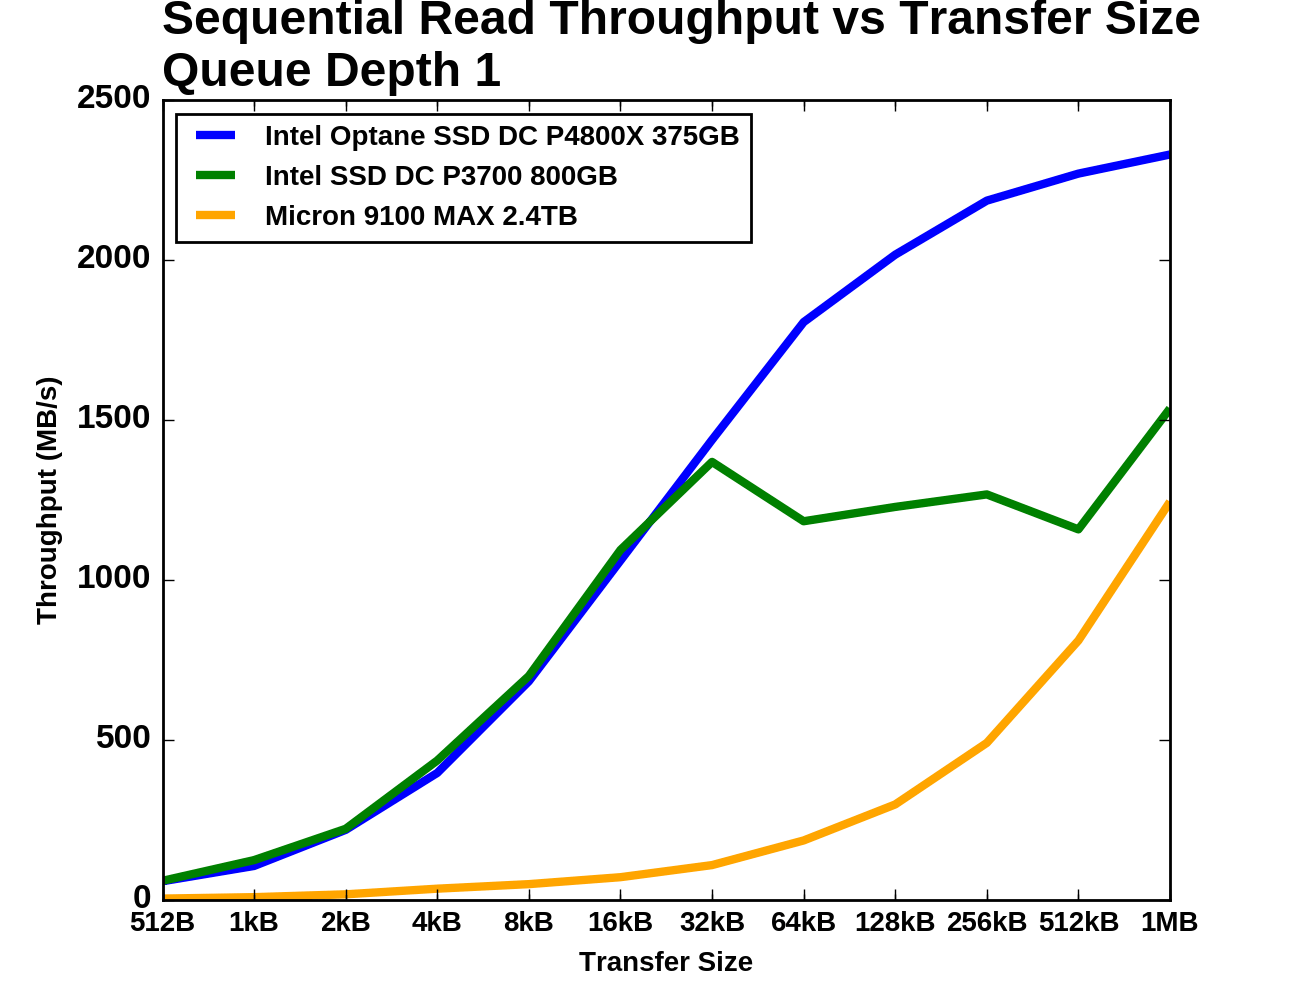
The test of sequential read performance at different transfer sizes was conducted at queue depth 1. Each transfer size was used for four minutes, and the throughput was averaged over the final three minutes of each test segment.
 |
|||||||||
| Vertical Axis scale: | Linear | Logarithmic | |||||||
For transfer sizes up to 32kB, both Intel drives deliver similar sequential read speeds. Beyond 32kB the P3700 appears to be saturated but also highly inconsistent. The Micron 9100 is plodding along with very low but steadily growing speeds, and by the end of the test it has almost caught up with the Intel P3700. It was at least ten times slower than the Optane SSD until the transfer size reached 64kB. The Optane SSD passes 2GB/s with 128kB transfers and finishes the test at 2.3GB/s.
Queue Depth > 1
For testing sequential read speeds at different queue depths, we use the same overall test structure as for random reads: total queue depths of up to 64 are tested using a maximum of four threads. Each thread is reading sequentially but from a different region of the drive, so the read commands the drive receives are not entirely sorted by logical block address.
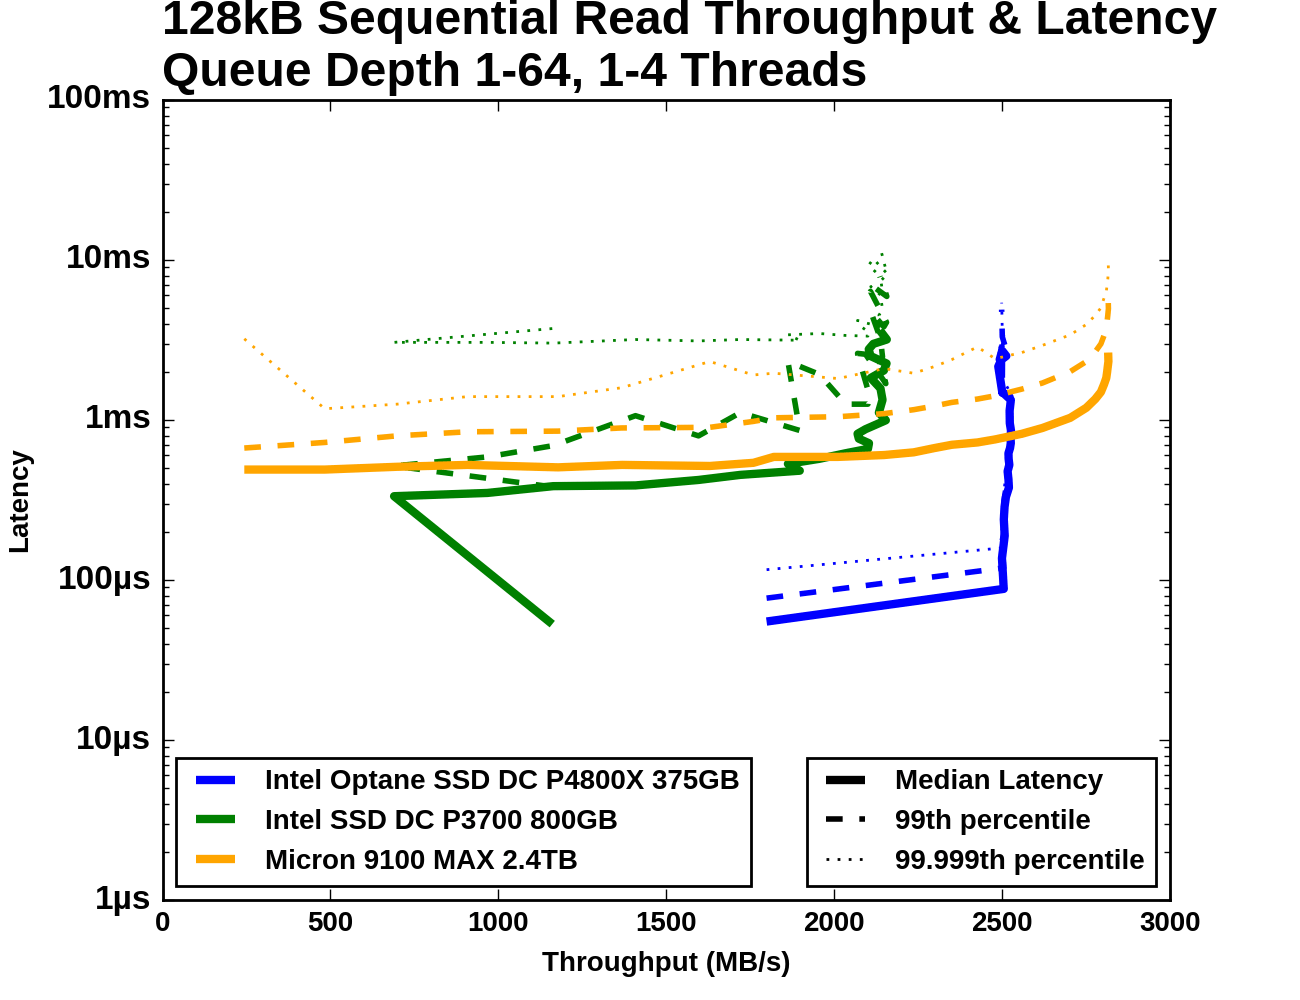
The Optane SSD DC P4800X starts out with a far higher QD1 sequential read speed than either flash SSD can deliver. The Optane SSD's median latency at QD1 is not significantly better than what the Intel P3700 delivers, but the P3700's 99th and 99.999th percentile latencies are at least an order of magnitude worse. Beyond QD1, the Optane SSD saturates while the Intel P3700 takes a temporary hit to throughput and a permanent hit to latency. The Micron 9100 starts out with low throughput and fairly high latency, but with increasing queue depth it manages to eventually surpass the Optane SSD's maximum throughput, albeit with ten times the latency.
 |
|||||||||
| Vertical Axis units: | IOPS | MB/s | |||||||
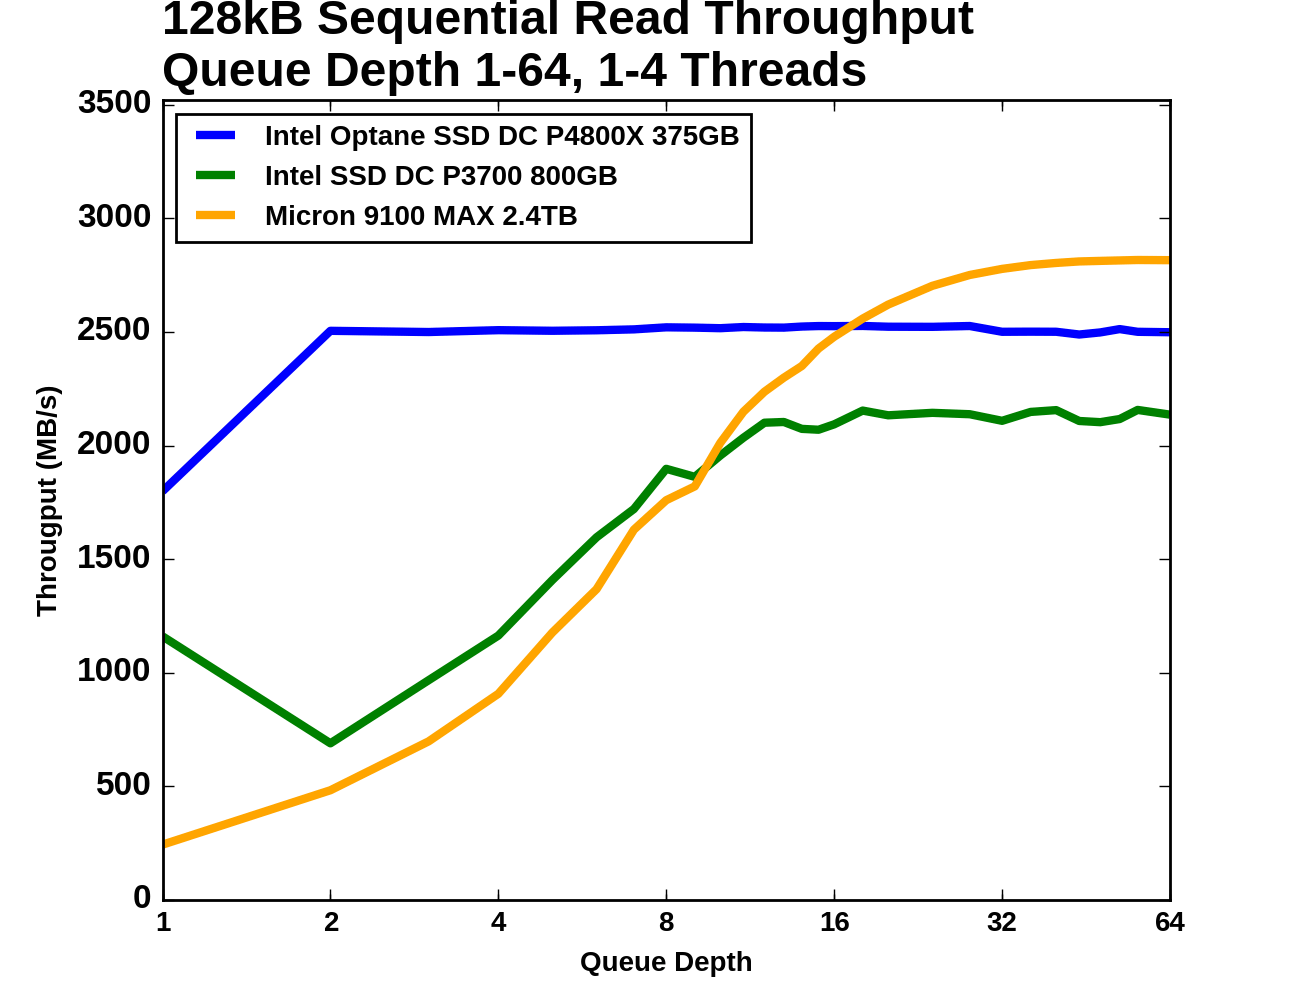
The Intel Optane SSD DC P4800X starts this test at 1.8GB/s for QD1, and delivers 2.5GB/s at all higher queue depths. The Intel P3700 performs significantly worse when a second QD1 thread is introduced, but by the time there are four threads reading from the drive the total throughput has recovered. The Intel P3700 saturates a little past QD8, which is where the Micron 9100 passes it. The Micron 9100 then goes on to surpass the Optane SSD's throughput above QD16, but it too has saturated by QD64.
 |
|||||||||
| Mean | Median | 99th Percentile | 99.999th Percentile | ||||||
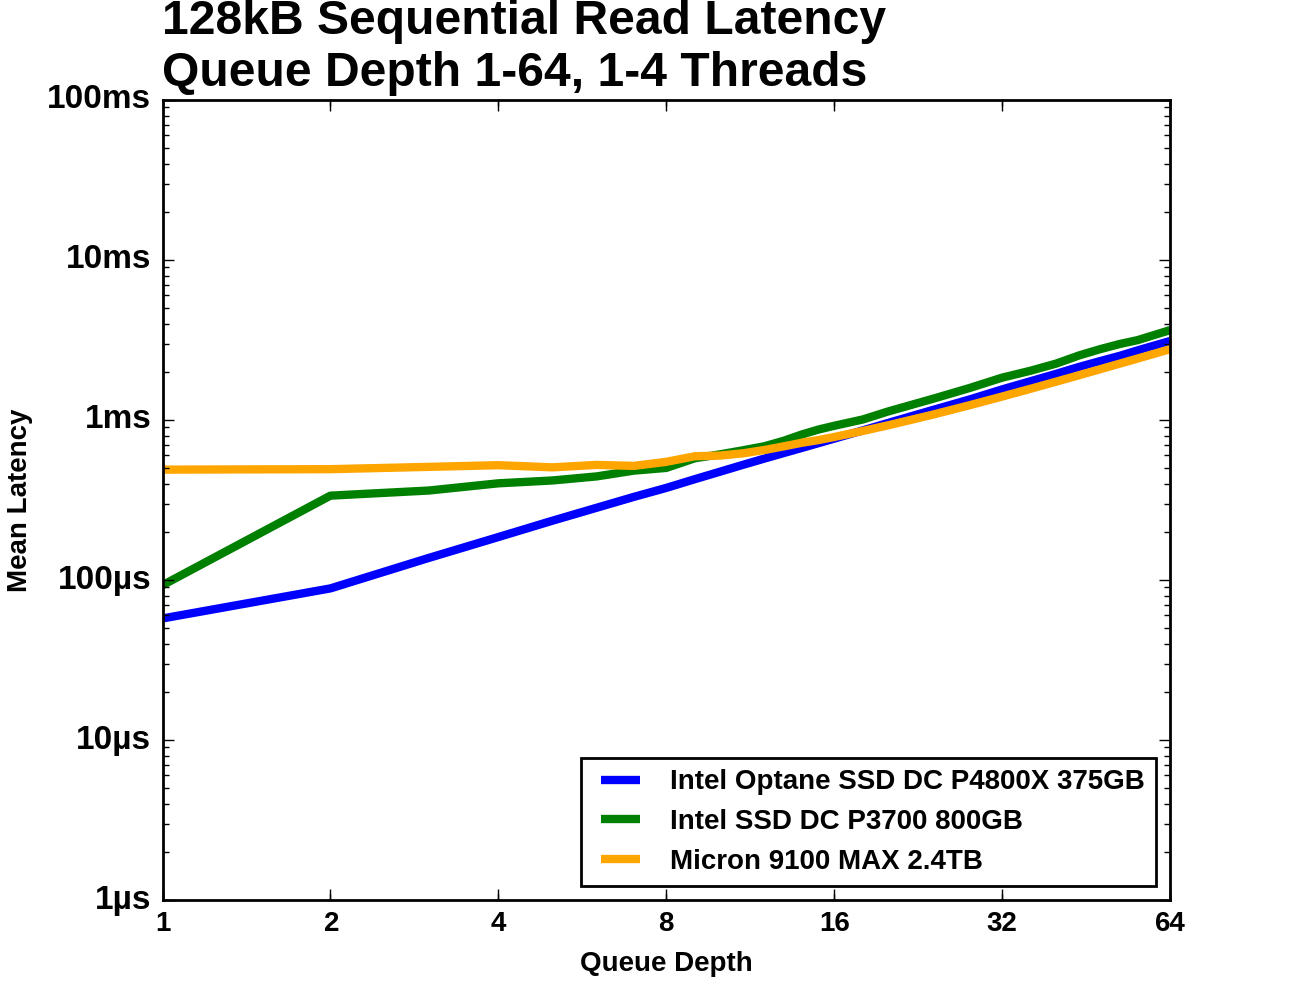
The Optane SSD's latency increases modestly from QD1 to QD2, and then unavoidably increases linearly with queue depth due to the drive being saturated and unable to offer any better throughput. The Micron 9100 starts out with almost ten times the average latency, but is able to hold that mostly constant as it picks up most of its throughput. Once the 9100 passes the Optane SSD in throughput it is delivering slightly better average latency, but substantially higher 99th and 99.999th percentile latencies. The Intel P3700's 99.999th percentile latency is the worst of the three across almost all queue depths, and its 99th percentile latency is only better than the Micron 9100's during the early portions of the test.
Sequential Write
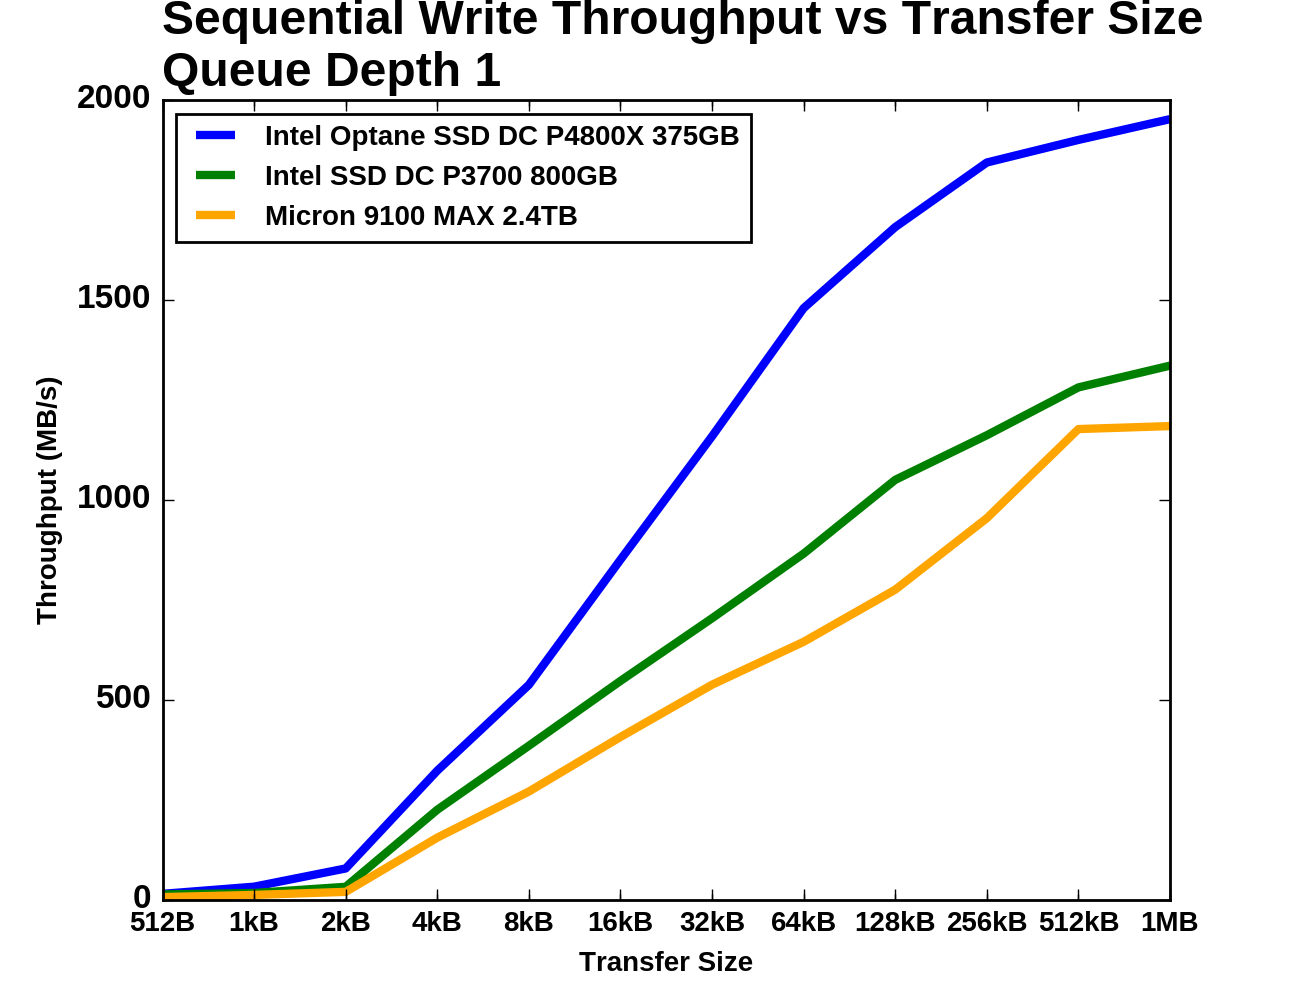
The sequential write tests are structured identically to the sequential read tests save for the direction the data is flowing. The sequential write performance of different transfer sizes is conducted with a single thread operating at queue depth 1. For testing a range of queue depths, a 128kB transfer size is used and up to four worker threads are used, each writing sequentially but to different portions of the drive. Each sub-test (transfer size or queue depth) is run for four minutes and the performance statistics ignore the first minute.
 |
|||||||||
| Vertical Axis scale: | Linear | Logarithmic | |||||||
As with random writes, sequential write performance doesn't begin to take off until transfer sizes reach 4kB. Below that size, all three SSDs offer dramatically lower throughput, with the Optane SSD narrowly ahead of the Intel P3700. The Optane SSD shows the steepest growth as transfer size increases, but it and the Intel P3700 begin to show diminishing returns beyond 64kB. The Optane SSD almost reaches 2GB/s by the end of the test while the Intel P3700 and the Micron 9100 reach around 1.2-1.3GB/s.
Queue Depth > 1
When testing sequential writes at varying queue depths, the Intel SSD DC P3700's performance was highly erratic. We did not have sufficient time to determine what was going wrong, so its results have been excluded from the graphs and analysis below.
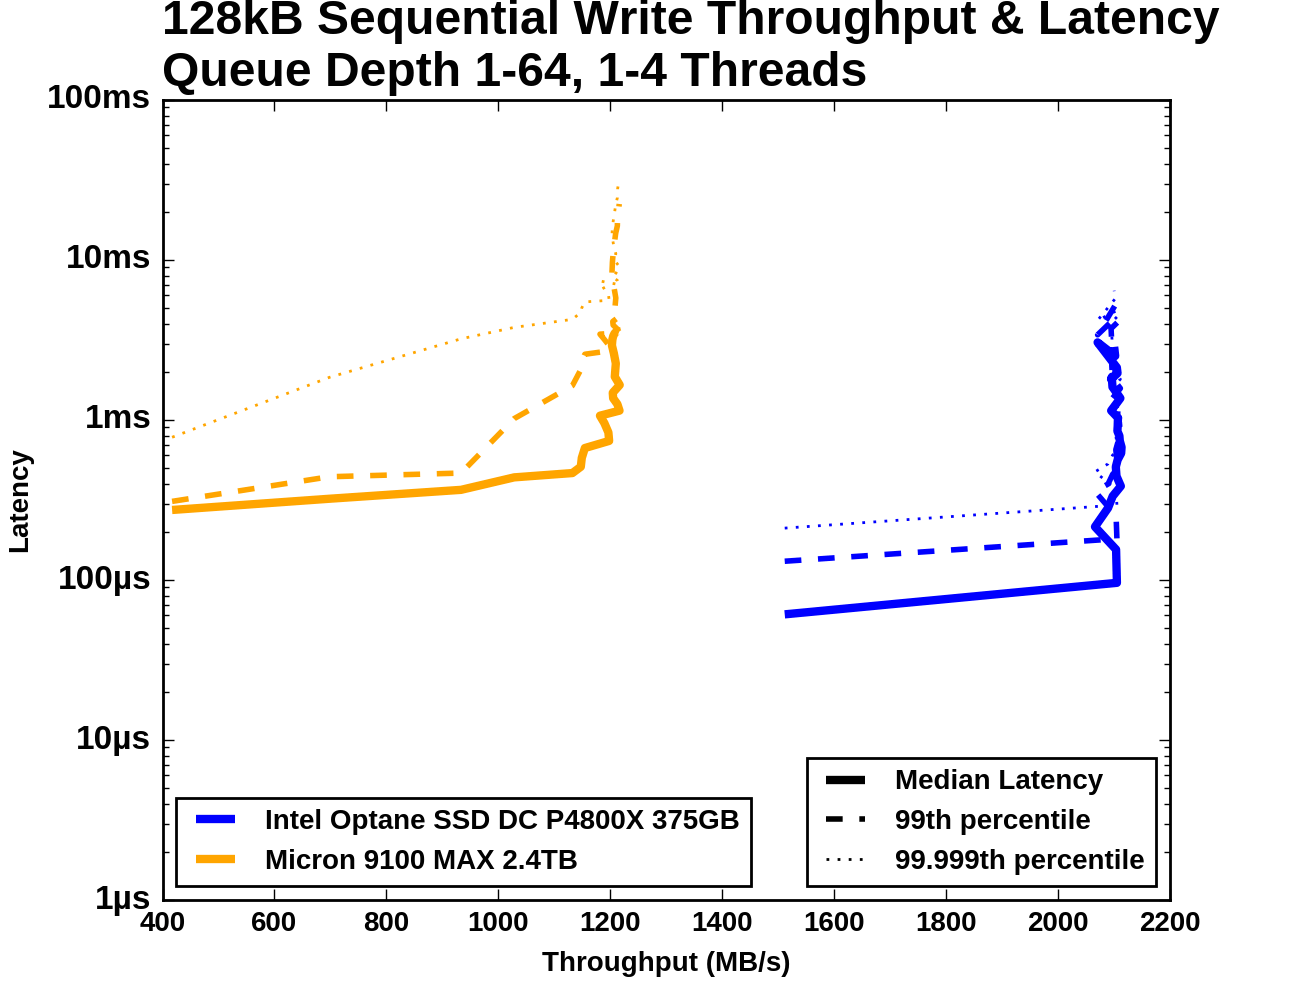
The Optane SSD DC P4800X delivers better sequential write throughput at every queue depth than the Micron 9100 can deliver at any queue depth. The Optane SSD's latency increases only slightly as it reaches saturation while the Micron 9100's 99th percentile latency begins to climb steeply well before that drive reaches its maximum throughput. The Micron 9100's 99.999th percentile latency also grows substantially as throughput increases, but its growth is more evenly spread across the range of queue depths.
 |
|||||||||
| Vertical Axis units: | IOPS | MB/s | |||||||
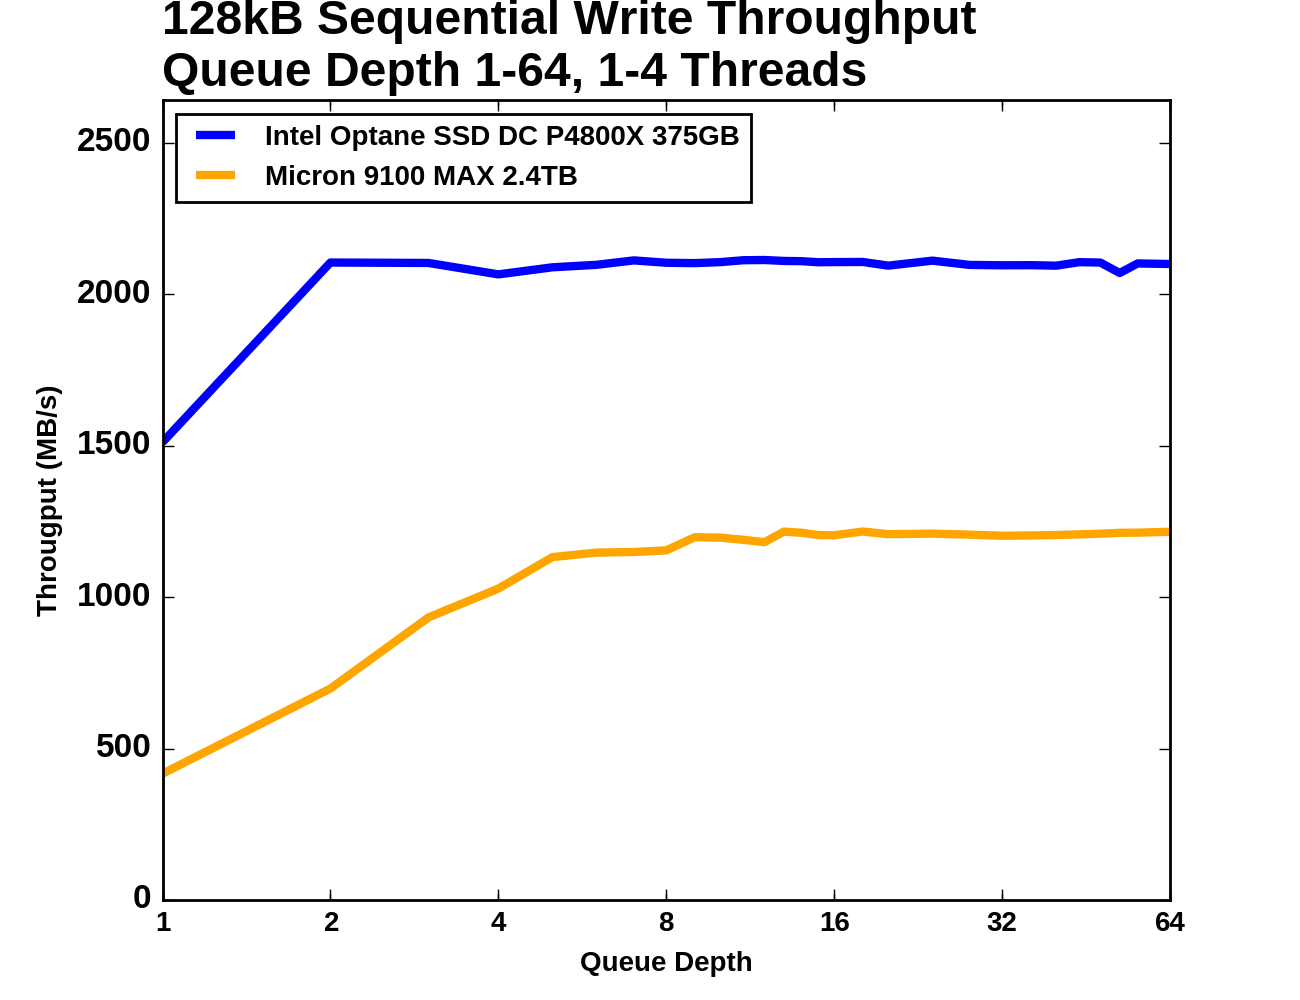
The Optane SSD reaches its maximum throughput at QD2 and maintains it as more threads and higher queue depths are introduced. The Micron 9100 only provides a little over half of the throughput and requires a queue depth of around 6-8 to reach that performance.
 |
|||||||||
| Mean | Median | 99th Percentile | 99.999th Percentile | ||||||
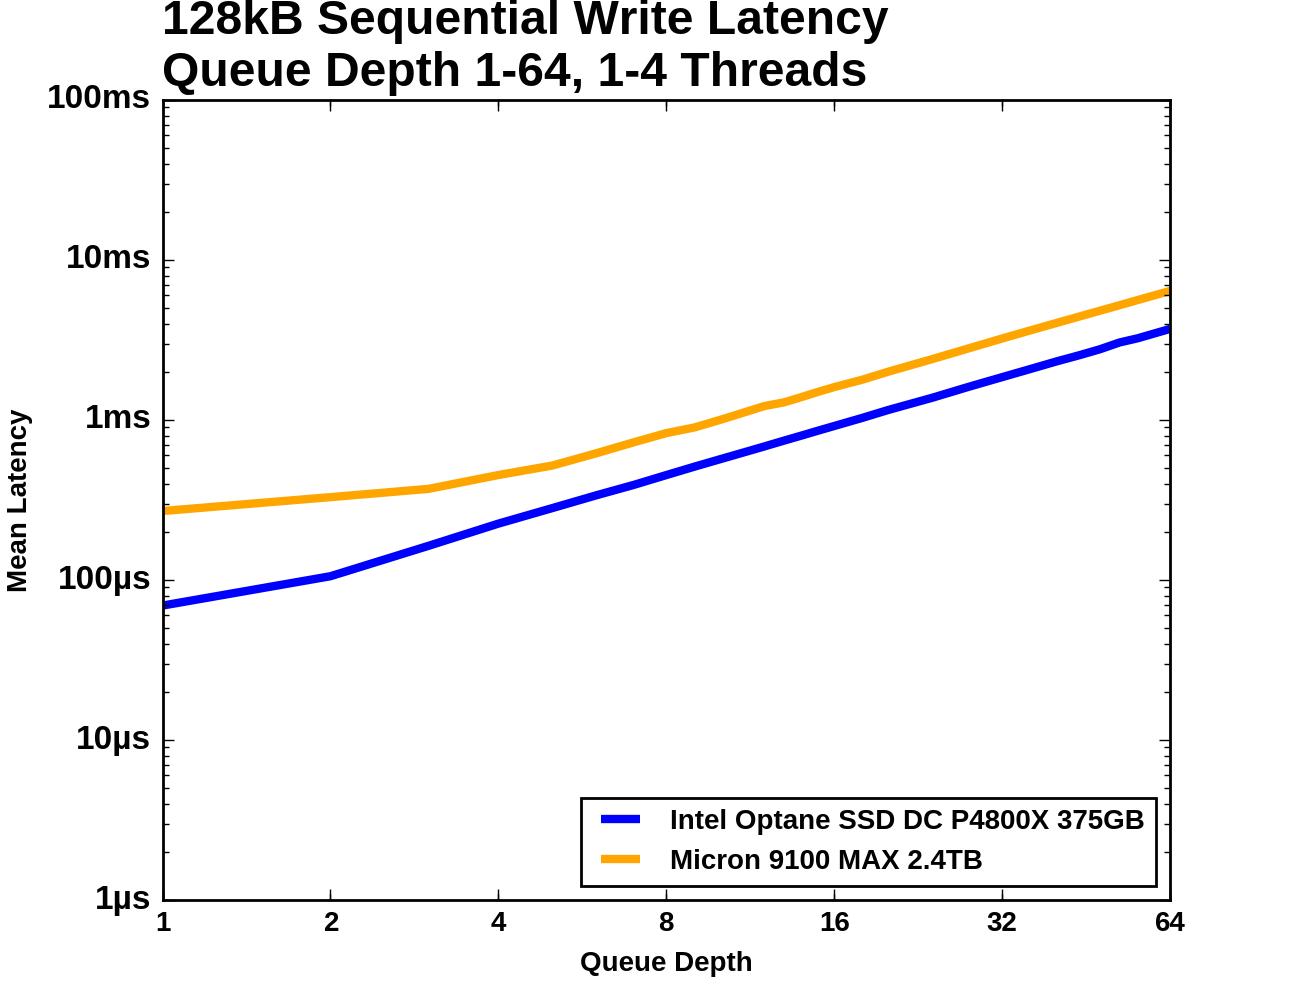
The Micron 9100's 99th percentile latency starts out around twice that of the Optane SSD, but at QD3 it increases sharply as the drive approaches its maximum throughput until it is an order of magnitude higher than the Optane SSD. The 99.999th percentile latencies of the two drives are separated by a wide margin throughout the test.


117 Comments
View All Comments
lilmoe - Thursday, April 20, 2017 - link
With all the Intel hype and PR, I was expecting the charts to be a bit more, um, flat? Looking at the deltas from start to finish of each benchmark, it looks like the drive has lots of characteristics similar to current flash based SSDs for the same price.Not impressed. I'll wait for your hands on review before bashing it more.
DrunkenDonkey - Thursday, April 20, 2017 - link
This is what the reviews don't explain and leave people in total darkness. You think your shiny new samsung 960 pro with 2.5g/s will be faster than your dusty old 840 evo barely scratching 500? Yes? Then you are in for a surprise - graphs look great, but check on loading times and real program/game benches and see it is exactly the same. That is why SSD reviews should always either divide to sections for the different usage or explain in great simplicity and detail what you need to look for in a PART of the graph. This one is about 8-10 times faster than your SSD so it IS impressive a lot, but price is equally impressive.lilmoe - Friday, April 21, 2017 - link
Yes, that's the problem with readers. They're comparing this to the 960 Pro and other M.2 and even SATA drives. Um.... NO. You compare this with similar form factor SSDs with similar price tags and heat sinks.And no, even QD1 benches aren't that big of a difference.
lilmoe - Friday, April 21, 2017 - link
"And no, even QD1 benches aren't that big of a difference"This didn't sound right, I meant to say that even QD1 isn't very different **compared to enterprise full PCIe SSDs*** at similar prices.
sor - Friday, April 21, 2017 - link
You're crazy. This thing is great. The current weak spot of NAND is on full display here, and xpoint is decimating it. We all know SSDs chug when you throw a lot of writes at them, all of Anandtech "performance consistency" benchmarks show that iops take a nose dive if you benchmark for more than a few seconds. Xpoint doesn't break a sweat and is orders of magnitude faster.I'm also pleasantly surprised at the consistency of sequential. A lot of noise was made about their sequential numbers not being as good as the latest SSDs, but one thing not considered is that SSDs don't hit that number until you get to high queue depths. For individual transfers xpoint seems to actually come closer to max performance.
tuxRoller - Friday, April 21, 2017 - link
I think the controllers have a lot to due with the perf.It's perf profile is eerily similar to the p3700 in too many cases.
Meteor2 - Thursday, April 20, 2017 - link
So... what is a queue depth? And what applications result in short or long QDs?DrunkenDonkey - Thursday, April 20, 2017 - link
Queue depth is concurent access to the drive, at the same time.For desktop/gaming you are looking at 4k random read (95-99% of the time), QD=1
For movie processing you are looking at sequential read/write at QD=1
For light file server you are looking at both higher blocks, say 64k random read and also sequential read, at QD=2/4
For heavy file server you go for QD=8/16
For light database you are looking for QD=4, random read/random write (depends on db type)
For heavy database you are looking for QD=16/more, random read/random write (depends on db type)
Meteor2 - Thursday, April 20, 2017 - link
Thank you!bcronce - Thursday, April 20, 2017 - link
A heavy file server only has such a small queue depth if using spinning rust, to keep down latency. When using SSDs, file servers have QDs in 64-256 range.