Previewing Silicon Motion SM2260 NVMe Controller With 3D MLC NAND (512GB)
by Billy Tallis on February 17, 2017 9:00 AM ESTSequential Read Performance
The sequential read test requests 128kB blocks and tests queue depths ranging from 1 to 32. The queue depth is doubled every three minutes, for a total test duration of 18 minutes. The test spans the entire drive, and the drive is filled before the test begins. The primary score we report is an average of performances at queue depths 1, 2 and 4, as client usage typically consists mostly of low queue depth operations.
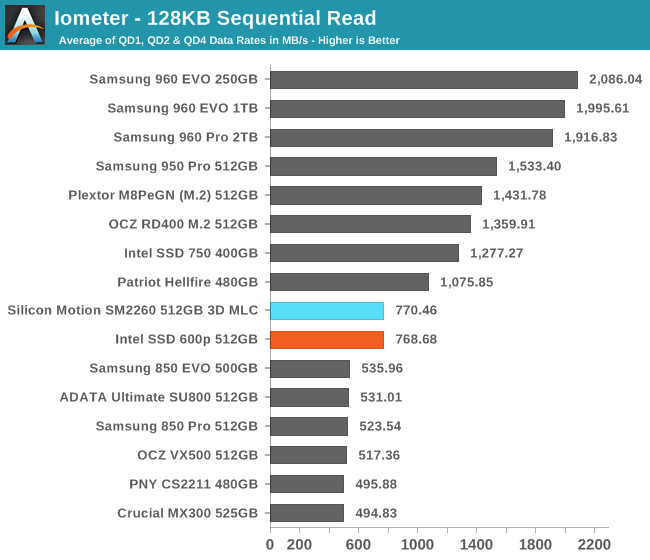
The SM2260 sample's sequential read performance is identical to the TLC-based Intel 600p that uses the same controller. Both fall right in the middle of the large gap between SATA SSDs and the next slowest NVMe SSD.
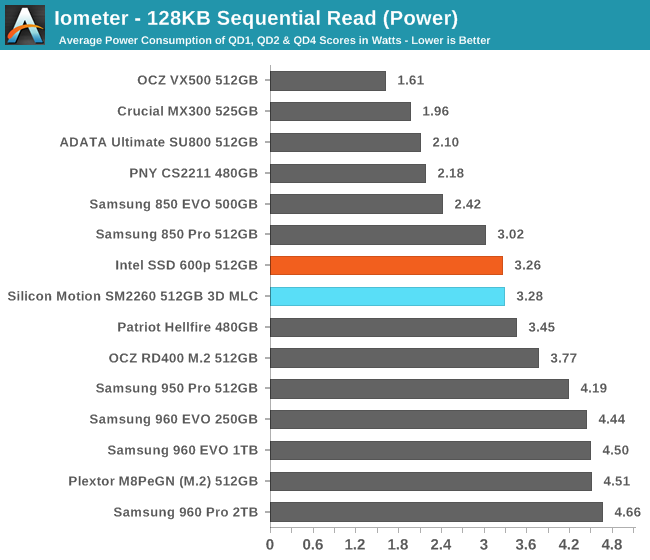
The story is the same for power consumption: the SM2260 sample with MLC is tied with the Intel SSD 600p with TLC. They are not as power-hungry as most NVMe SSDs, but the low performance means they are still less efficient.
 |
|||||||||
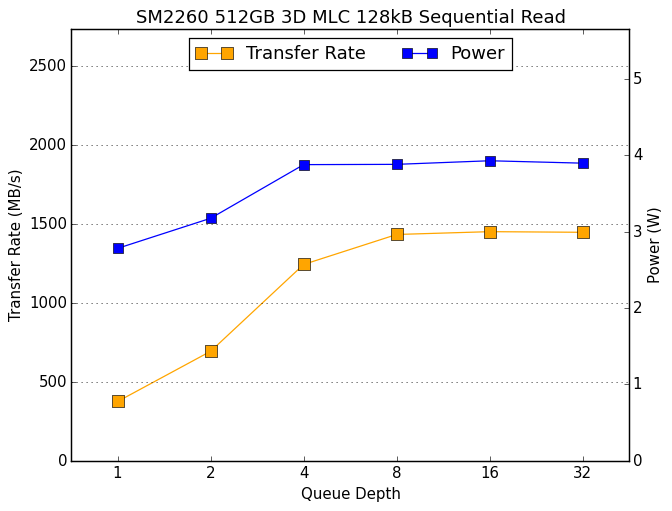
The SM2260 sample's power consumption tops out at QD4 but performance increases a little further at QD8 to just under 1500 MB/s. This performance at high queue depths is reasonable, but most of the competition can reach these speeds at much lower queue depths.
Sequential Write Performance
The sequential write test writes 128kB blocks and tests queue depths ranging from 1 to 32. The queue depth is doubled every three minutes, for a total test duration of 18 minutes. The test spans the entire drive, and the drive is filled before the test begins. The primary score we report is an average of performances at queue depths 1, 2 and 4, as client usage typically consists mostly of low queue depth operations.
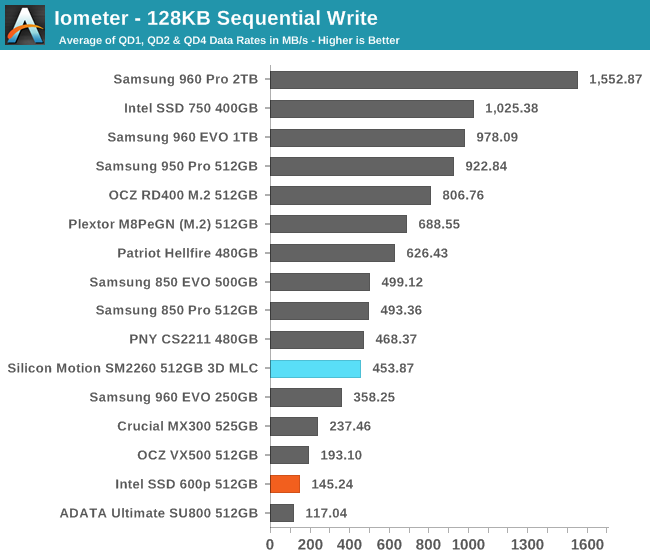
The sequential write speed of the SM2260 sample is slightly slower than the top tier of SATA SSDs, which the rest of the MLC-based NVMe SSDs have no trouble beating.
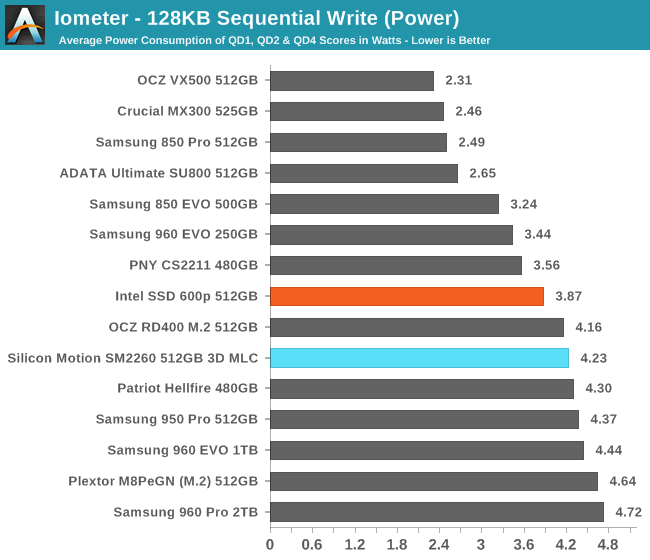
The SM2260 uses about the same amount of power as its NVMe competition, but delivers much less performance for it.
 |
|||||||||
The SM2260 sample's write performance starts out at around 900 MB/s but starts dropping due to garbage collection and an exhausted SLC cache less than a third of the way through the QD1 phase of the test. The average performance continues to drop throughout the rest of the test as the drive spends an increasing portion of its time on garbage collection, but it also continues to recover periodically to the 900 MB/s level.


27 Comments
View All Comments
motigez - Sunday, February 19, 2017 - link
Honestly, at this point, TLC is the only viable technology for Client market, the incremental performance benefit you may get on MLC based SSD just don't worth it, and I expect to see little to no traction on those moving forward.LordanSS - Sunday, February 19, 2017 - link
To be very honest, a 3D MLC at 40nm has very good endurance, which would be good for a usage of heavy writes.If you're dealing with video capture and editing, it'd be a good choice over 3D TLC, even tho 3D TLC at 40nm has decent endurance as well.
leexgx - Tuesday, February 21, 2017 - link
to bad they did not continue the BX100 line as it had insane low power use (still fast enough for a low end SSD) BX200 and higher was like the worst SSD for low end SSD and power useRanger1065 - Wednesday, February 22, 2017 - link
Does anyone really care about this? The number of comments seems to indicate a comprehensive "NO." Another article, another step towards oblivion. Great job Anandtech.BrokenCrayons - Wednesday, February 22, 2017 - link
I see you're back to once again try to decry the site. It's funny if things are so bad that you keep coming back to read articles, but that's a special sort of problem, I suppose. Anyway, since you're having trouble with reading comprehension, most of the comments swirl around the drive's poor performance relative to other products. Just because someone doesn't leap to their feet to applaud a device that landed at the bottom of a chart doesn't mean the reviewer, the article, or the company publishing it is doing something wrong by reporting their test results. Just because people are generally in agreement with the results via their comments certainly doesn't indicate there's a problem with the review. You're just trying to project your silly opinion on others and hope to bend reality to your will by getting prophetic about the future...or you're trolling...probably both.BrokenCrayons - Wednesday, February 22, 2017 - link
I see you're back to once again try to decry the site. It's funny if things are so bad that you keep coming back to read articles, but that's a special sort of problem, I suppose. Anyway, since you're having trouble with reading comprehension, most of the comments swirl around the drive's poor performance relative to other products. Just because someone doesn't leap to their feet to applaud a device that landed at the bottom of a chart doesn't mean the reviewer, the article, or the company publishing it is doing something wrong by reporting their test results. Just because people are generally in agreement with the results via their comments certainly doesn't indicate there's a problem with the review. You're just trying to project your silly opinion on others and hope to bend reality to your will by getting prophetic about the future...or you're trolling...probably both.watzupken - Saturday, February 25, 2017 - link
So far, the Silicon Motion and Phison's controllers always seem to perform poorly with consistency. They don't seem like they are trying to fix it with each iteration of their controller.