The Intel SSD 600p (512GB) Review
by Billy Tallis on November 22, 2016 10:30 AM ESTMixed Random Read/Write Performance
The mixed random I/O benchmark starts with a pure read test and gradually increases the proportion of writes, finishing with pure writes. The queue depth is 3 for the entire test and each subtest lasts for 3 minutes, for a total test duration of 18 minutes. As with the pure random write test, this test is restricted to a 16GB span of the drive, which is empty save for the 16GB test file.
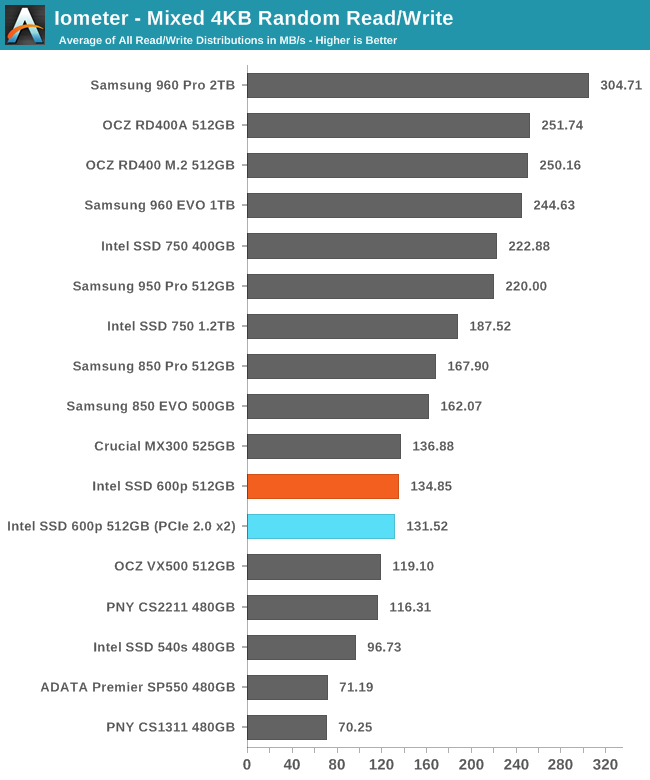
The 600p was slower than the Crucial MX300 on random writes but faster at random reads. On the mixed random I/O test, they average out to a tie.
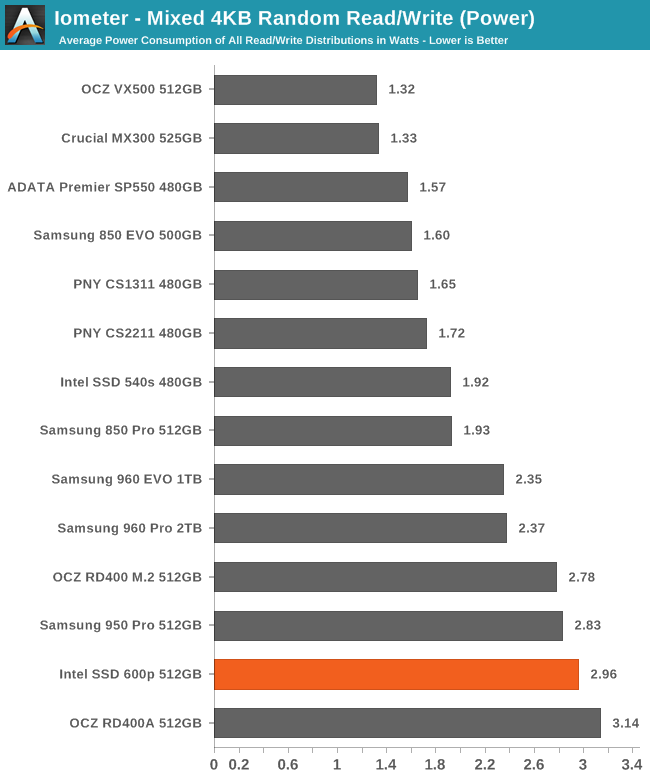
Despite performing the same overall, the 600p used more than twice the power of the MX300. The SM2260 controller simply imposes far too much power overhead than is appropriate when paired with slow TLC NAND.
 |
|||||||||
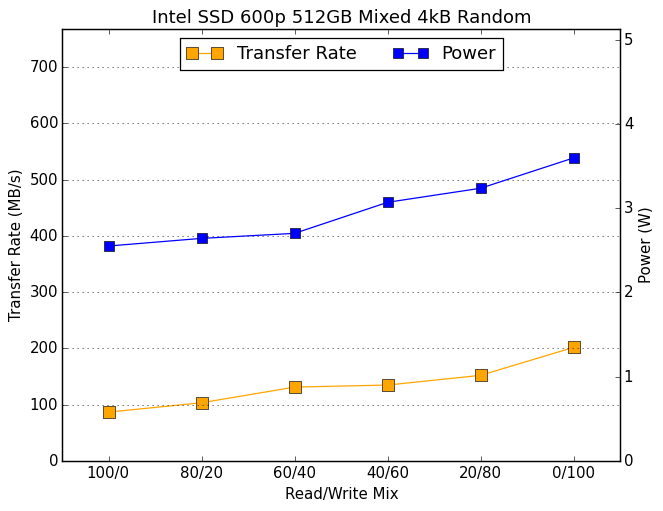
The 600p performs better as more writes are added in to the mix, but it doesn't spike in performance for the final all-writes phase of the test. This means its performance is much more balanced than many other drives that simply run up the score at the end.
Mixed Sequential Read/Write Performance
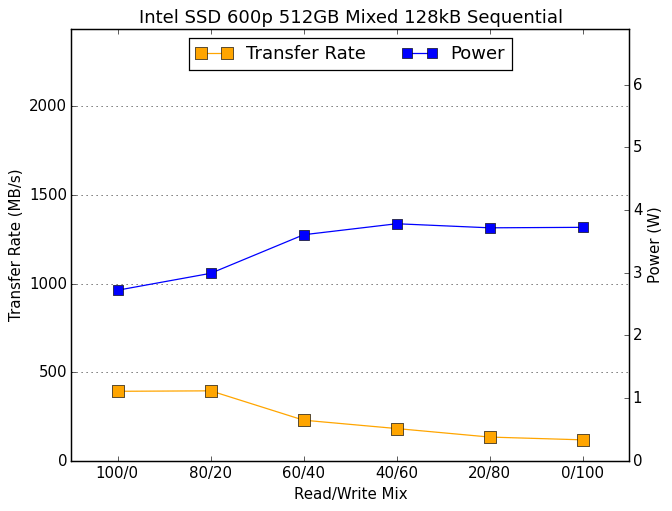
The mixed sequential access test covers the entire span of the drive and uses a queue depth of one. It starts with a pure read test and gradually increases the proportion of writes, finishing with pure writes. Each subtest lasts for 3 minutes, for a total test duration of 18 minutes. The drive is filled before the test starts.
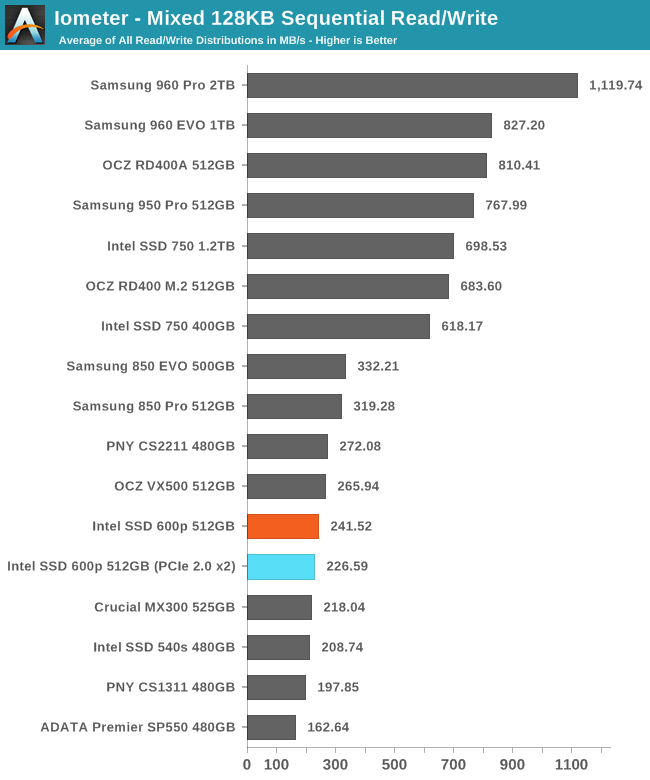
The faster-than-SATA read speeds of the 600p aren't enough to compensate for the poor write speeds, so it ends up scoring only slightly ahead of the budget SATA SSDs.
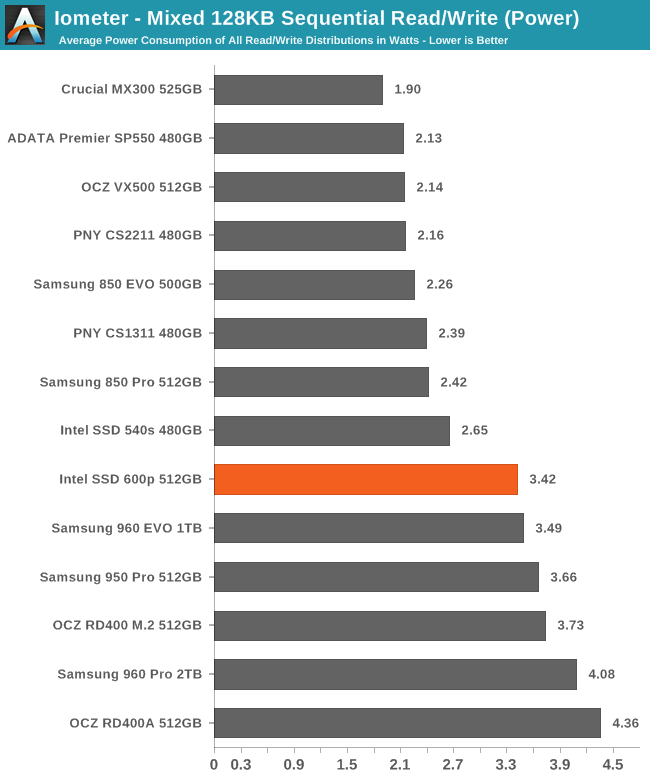
There is a clear separation in power consumption between the SATA and PCIe SSDs. For once, the 600p is the lowest power PCIe SSD, but it is still the least efficient due to its low performance.
 |
|||||||||
As expected, adding writes to the mix drags down performance, though there aren't enough writes in the 80/20 phase to have much of an impact yet. It is a hallmark of low-end SSDs to see performance stay low through the end of the test, while high-performance SSDs typically have a U-shaped performance curve here.


63 Comments
View All Comments
ramvalleru - Tuesday, December 6, 2016 - link
What advantages does Intel 600p has over Samsung 850 Evo with its 4 x pci-e. Less bottleneck with multi application writes and reads?KAlmquist - Friday, December 9, 2016 - link
If you mean compared to the 960 EVO, the 600p is less expensive. Also, with the 600p you are getting the Intel brand name and quality control, backed up with a 5 year warranty vs. a 3 year warranty on the 960 EVO.RetsamCP - Saturday, December 24, 2016 - link
I may just be a little confused but how did the 960 Pro 2TB bench and average service time latency of 160.9 ms in the Destroyer bench but score 0 for percentage of service times >100 ms?There had to be service times over 100 ms for the average to be over 100 ms, but how was the average affected so much when service times >100 ms made up <0.01% of the total benchmark?
What am I missing?