The Intel SSD 600p (512GB) Review
by Billy Tallis on November 22, 2016 10:30 AM ESTSequential Read Performance
The sequential read test requests 128kB blocks and tests queue depths ranging from 1 to 32. The queue depth is doubled every three minutes, for a total test duration of 18 minutes. The test spans the entire drive, and the drive is filled before the test begins. The primary score we report is an average of performances at queue depths 1, 2 and 4, as client usage typically consists mostly of low queue depth operations.
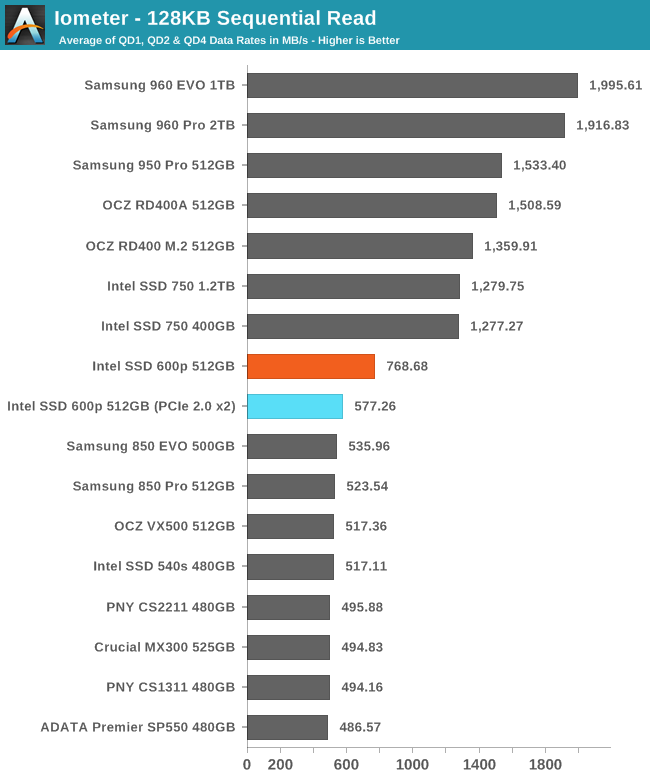
Even when limited to PCIe 2.0 x2 the 600p has slightly higher sequential read speed than SATA drives can manage, but when given more PCIe bandwidth the 600p doesn't catch up to the more expensive NVMe drives.
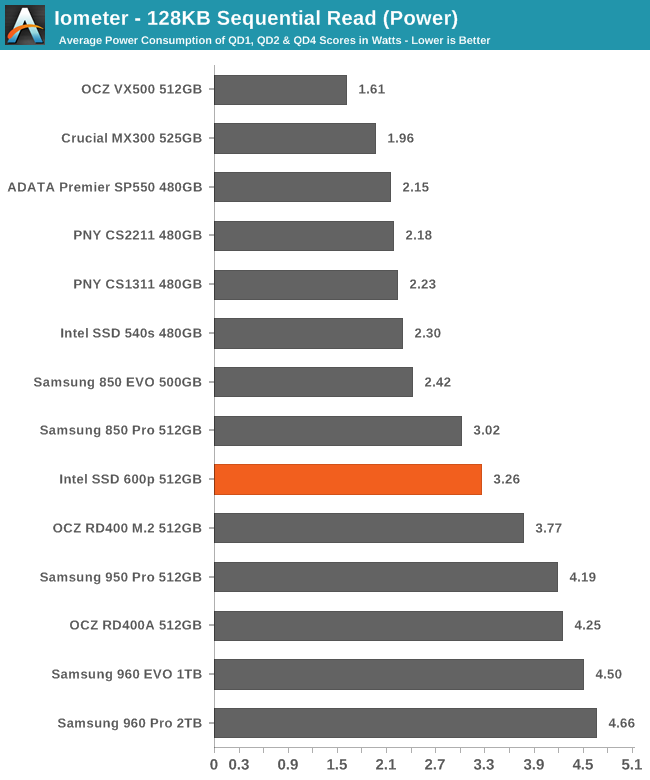
The 600p actually manages to surpass the power efficiency of several SATA SSDs, but it can't compete with the other NVMe drives that deliver twice the data rate.
 |
|||||||||
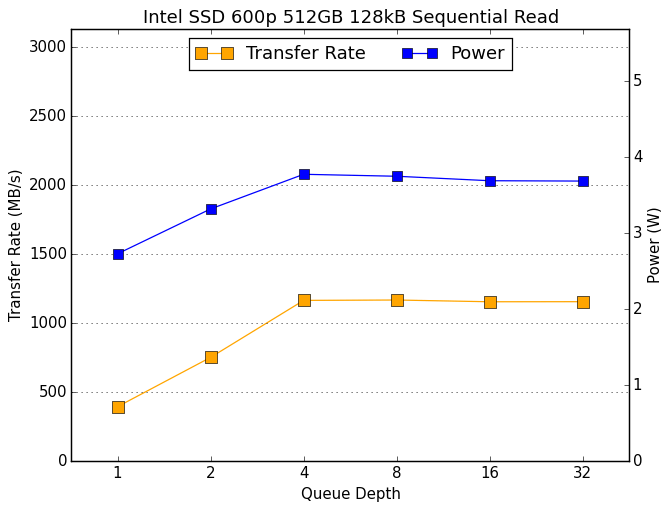
The 600p starts at just under 400MB/s hits its read speed limit at QD4 with around 1150MB/s. The other PCIe SSDs perform at least that well at QD1 and go up from there.
Sequential Write Performance
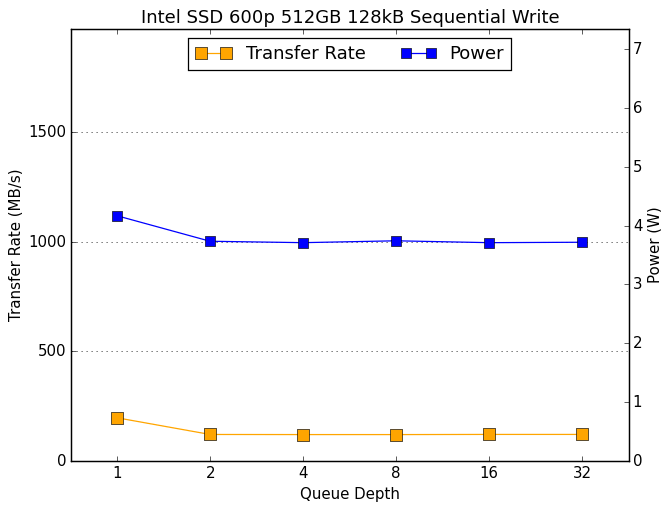
The sequential write test writes 128kB blocks and tests queue depths ranging from 1 to 32. The queue depth is doubled every three minutes, for a total test duration of 18 minutes. The test spans the entire drive, and the drive is filled before the test begins. The primary score we report is an average of performances at queue depths 1, 2 and 4, as client usage typically consists mostly of low queue depth operations.
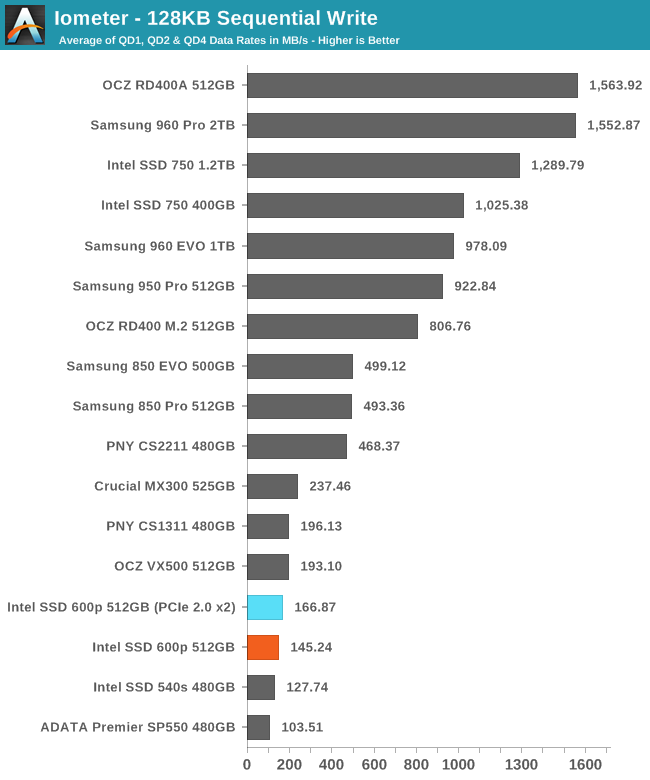
It is a surprise to see the Intel 600p performing better in the motherboard's M.2 slot than in the PCIe 3.0 adapter, but in both cases the sustained write speeds are so slow that the interface is not a limitation.
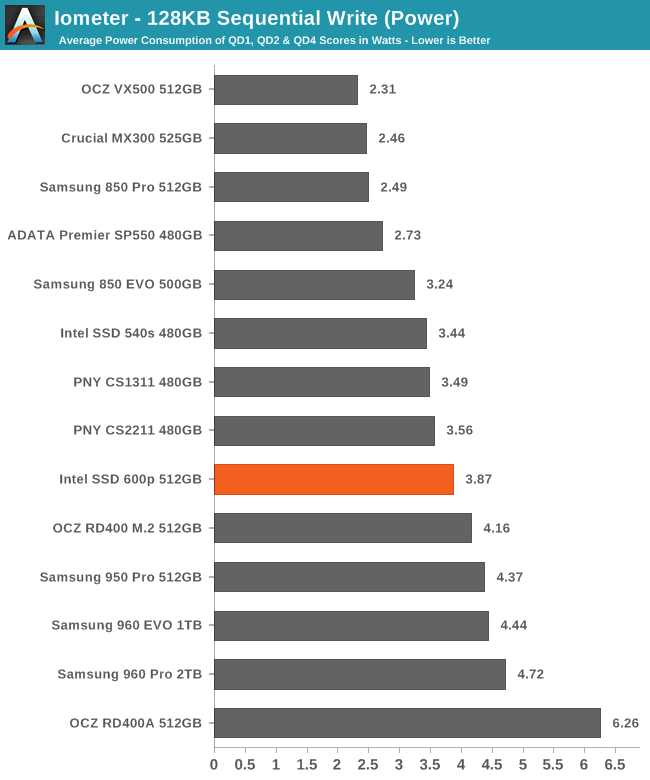
The power consumption of the 600p when it's in the PCIe 3.0 adapter is high enough that temperature may be a factor in this test, and the 600p may have performed better in the motherboard's M.2 slot simply due to better positioning and orientation in the case.
 |
|||||||||
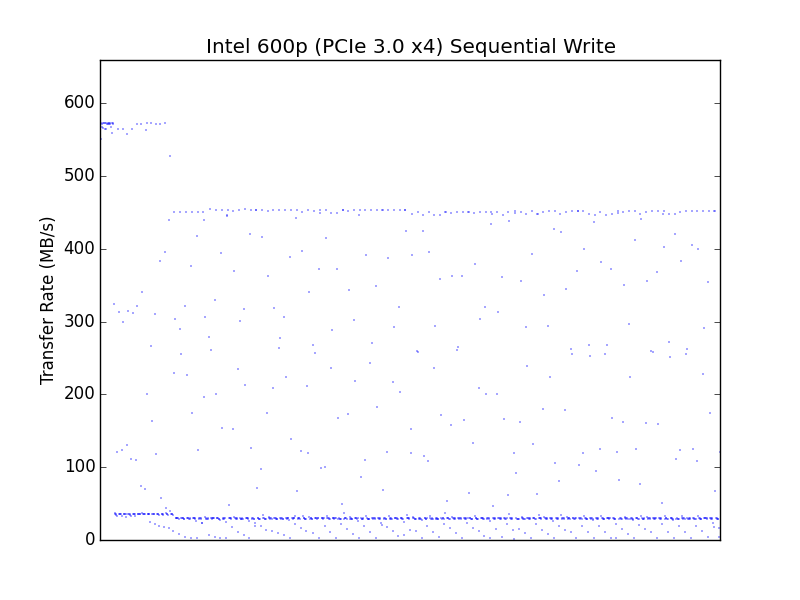
It is a familiar pattern for PCIe SSDs to see the highest write speeds at the beginning of the test, and a completely flat graph thereafter as thermal limits kick in. We're just used to seeing the performance curve near the top of the graph instead of at the bottom.
 |
|||||||||
| PCIe 3.0 x4 adapter | motherboard M.2 PCIe 2.0 x2 | ||||||||
A comparison of the second by second performance during the sequential write test shows that the 600p reaches a steady state with the same kind of inconsistency we saw for random writes, and in the PCIe 3.0 adapter the performance is reduced across the board and the worst drops in performance are much closer to zero.


63 Comments
View All Comments
Billy Tallis - Tuesday, November 22, 2016 - link
The old firmware. The testbed has been too busy with PCIe SSDs lately for me to have a chance to put the November MX300 update through its paces.seanmac2 - Wednesday, November 23, 2016 - link
I would never intentionally buy this product but it bothers me anyway because laptops advertise things like "512 GB PCIe SSD" and I'm left wondering if I'll get this or something sweet like a Samsung 950/951/960.ddriver - Wednesday, November 23, 2016 - link
You get what you pay for. The 600p will likely go into budget products, which won't be CPU powerhouses which may be limited by the sdd performance. Most applications, even prosumer grade software, shows like 1-2$ improvement from going sata to nvme, and this particular product, although technically nvme is more in the sata ballpark.Flying Aardvark - Friday, November 25, 2016 - link
That's why Intel products cost more than others. You do get what you pay for. Intel SSDs have the industry's best reliability, which matters most when your drive fails prematurely. Unlikely if using M.2 you'll see any real world difference between the 600P and anything else.The true step up is the heavy duty Intel 750 stuff with heatsink and zero throttling concerns under heavy, sustained load.
Meteor2 - Wednesday, November 23, 2016 - link
A suggestion: you could link to the previous reviews of devices the first time you mention them, e.g. the 850 Evo. Would save hunting around for them/encourage more page views a people read those reviews before coming back.Meteor2 - Wednesday, November 23, 2016 - link
So where's this drive falling down compared to the other NVMe drives? Is it the TLC NAND, the construction of the dies, the controller, or something else?DominionSeraph - Wednesday, November 23, 2016 - link
"1750MB/s sequential read", and not a single test showing if it could actually reach 1750MB/s sequential read in any real life tasks.Great job there.
beginner99 - Wednesday, November 23, 2016 - link
WTF is this? It's another useless TLC crap drive. Intel, your ruining your reputation and brand with crap like this. I don't see why I should buy this over a MX300 or similar crappy TLC entry level ssd that is even cheaper.Flying Aardvark - Friday, November 25, 2016 - link
Everything is going to be 3D TLC soon except the truly next-level stuff like the Intel 750. 3D TLC is not planar TLC.creed3020 - Wednesday, November 23, 2016 - link
Billy, when are these results going to be included in Bench? I was hoping to compare to my Crucial MX100 but cannot find these Intel drives under SSD2015.