The Samsung 850 EVO 4TB SSD Review
by Billy Tallis on July 11, 2016 10:00 AM ESTMixed Random Read/Write Performance
The mixed random I/O benchmark starts with a pure read test and gradually increases the proportion of writes, finishing with pure writes. The queue depth is 3 for the entire test and each subtest lasts for 3 minutes, for a total test duration of 18 minutes. As with the pure random write test, this test is restricted to a 16GB span of the drive, which is empty save for the 16GB test file.
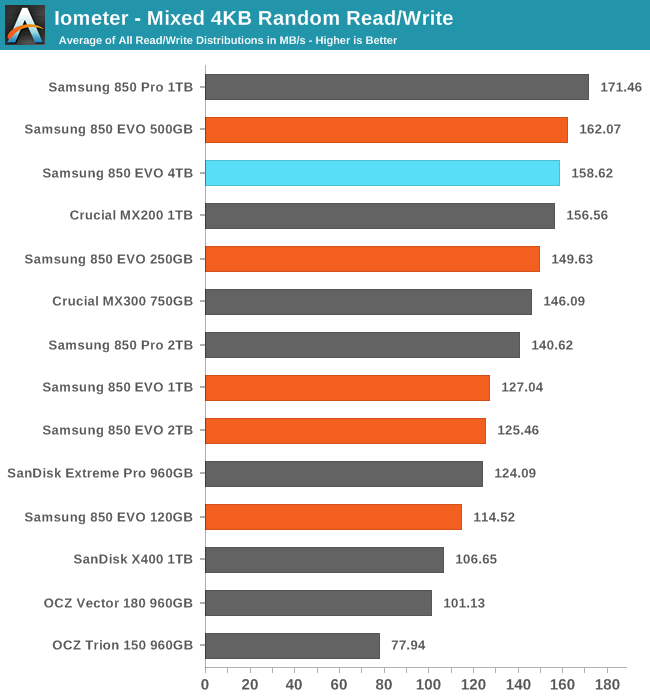
The mixed random I/O performance of the 4TB 850 EVO is much better than the other large 850 EVOs, putting te 4TB model close to the top of the chart.
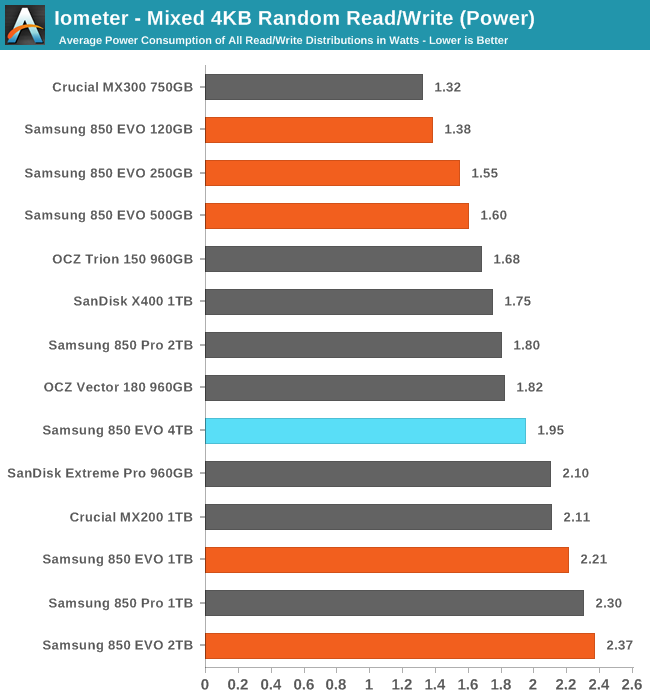
The 4TB 850 EVO also manages a large reduction in power usage as compared with the 1TB and 2TB 850 EVOs, making the 4TB much more efficient.
 |
|||||||||
Unlike the other 850 EVOs, the 4TB never loses performance as the proportion of writes in the test workload increases. Meanwhile, the power draw is essentially constant until near the end of the test.
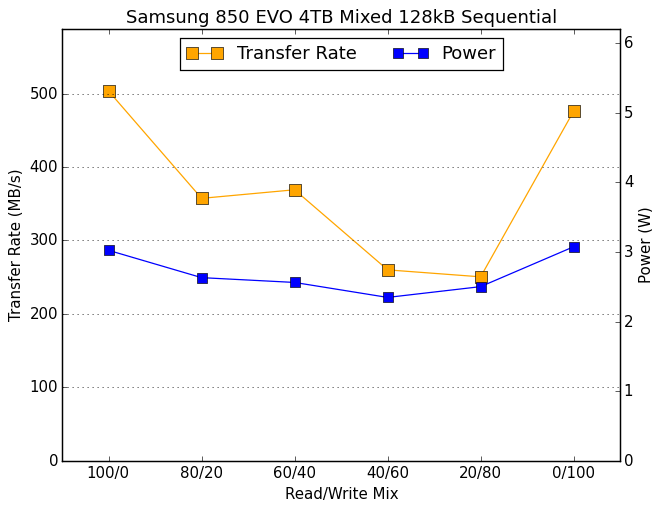
Mixed Sequential Read/Write Performance
The mixed sequential access test covers the entire span of the drive and uses a queue depth of one. It starts with a pure read test and gradually increases the proportion of writes, finishing with pure writes. Each subtest lasts for 3 minutes, for a total test duration of 18 minutes. The drive is filled before the test starts.
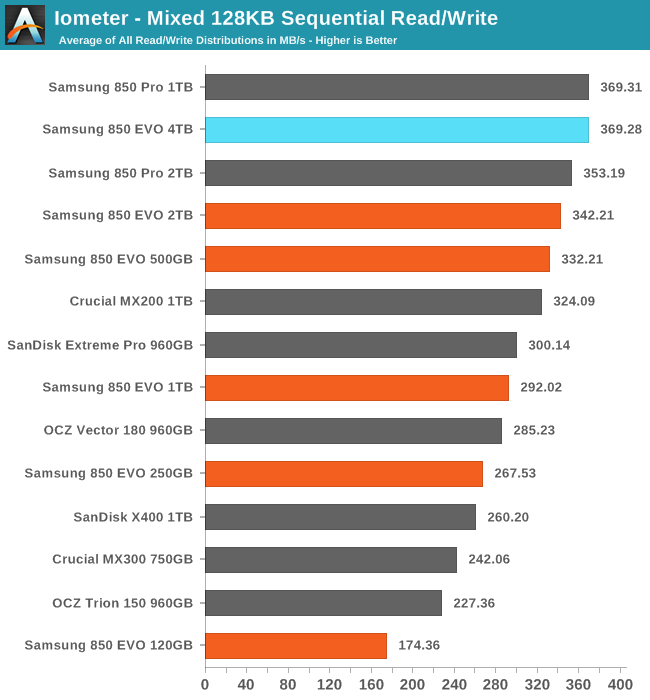
The 4TB 850 EVO is essentially tied for the best mixed sequential read and write performance.
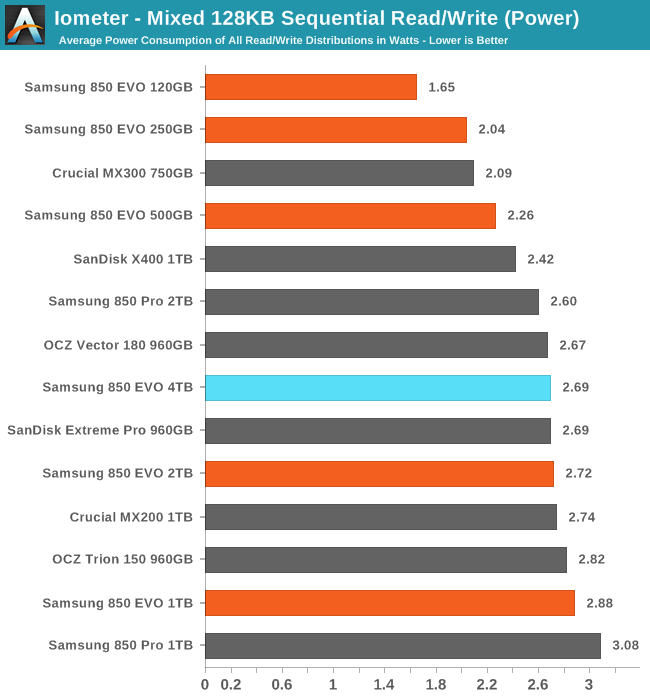
The 4TB 850 EVO averages using slightly less power than the 2TB model, and it is one of the most efficient of the large drives.
 |
|||||||||
The usual pattern is for performance on this test to resemble a bathtub curve, but the 2TB 850s and the 4TB 850 EVO don't lose as much of their performance during the first half of the test, leading them to bottom out much later than most other drives.


145 Comments
View All Comments
Lolimaster - Tuesday, July 12, 2016 - link
If you "work" with 4k raw videos you can afford the enterprise level SSD's with their multi petabyte endurance rating.mapesdhs - Wednesday, July 13, 2016 - link
Exactly. I know someone who's been testing 8K editing at a movie company, he was able to get over 8GB/sec from a good Enterprise PCIe device, with consistent performance being absolutely critical. He did try RAIDs of 850 Pros but they just couldn't handle it.AnnonymousCoward - Monday, July 11, 2016 - link
Look at the graph on this page...the Samsung showed bad sectors 4 times earlier than the others: http://techreport.com/review/27909/the-ssd-enduran...3 things matter to me with SSDs: cost, reliability, and UX performance.
DPUser - Monday, July 11, 2016 - link
That was 2-D TLC. The 850 uses much more robust 3-D NAND.AnnonymousCoward - Tuesday, July 12, 2016 - link
I guess we need updated data then :)ddriver - Monday, July 11, 2016 - link
Well, that's the 840 pro - old stuff... Also, it is possible that samsung have more strict criteria of when a sector becomes unreliable and requires reallocation.Palorim12 - Tuesday, July 12, 2016 - link
But in the end, didn't the 840 Pro outlast all the other drives?hojnikb - Monday, July 11, 2016 - link
That endurance rating is simply for segmentation purposes. In reality, drive should easily reach 4PB+ of writes, before crapping out.mdw9604 - Tuesday, July 12, 2016 - link
Can you explain? I'd like to buy one for a project I am working on, if this is true.mdw9604 - Tuesday, July 12, 2016 - link
I agree. I know its EVO...but write endurance on a drive that expensive is pretty bad.