The OCZ Trion 150 SSD Review
by Billy Tallis on April 1, 2016 8:00 AM ESTSequential Read Performance
The sequential read test requests 128kB blocks and tests queue depths ranging from 1 to 32. The queue depth is doubled every three minutes, for a total test duration of 18 minutes. The test spans the entire drive, and the drive is filled before the test begins. The primary score we report is an average of performances at queue depths 1, 2 and 4, as client usage typically consists mostly of low queue depth operations.
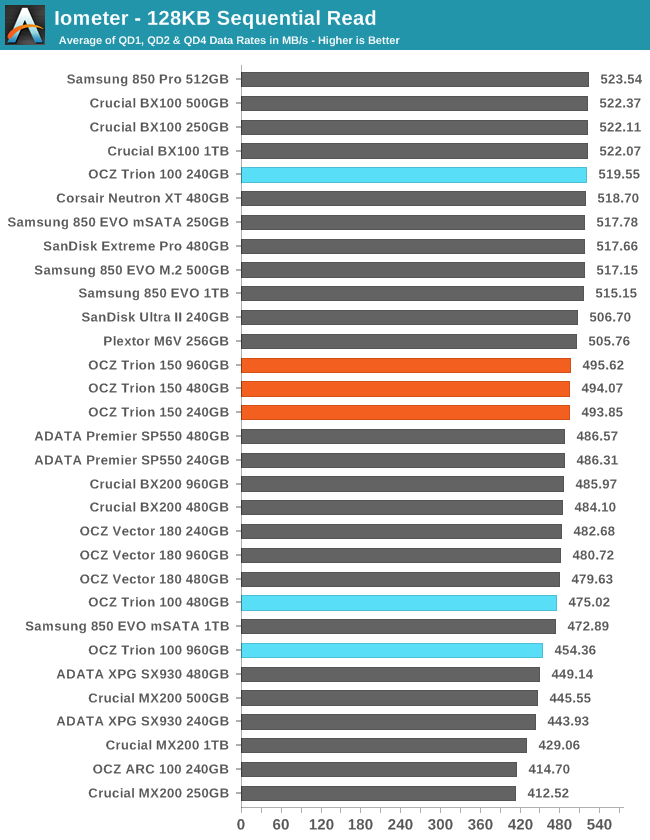
All three sizes of the Trion 150 have very similar sequential read speeds and they fall in the middle of a large number of drives that all perform very similarly.
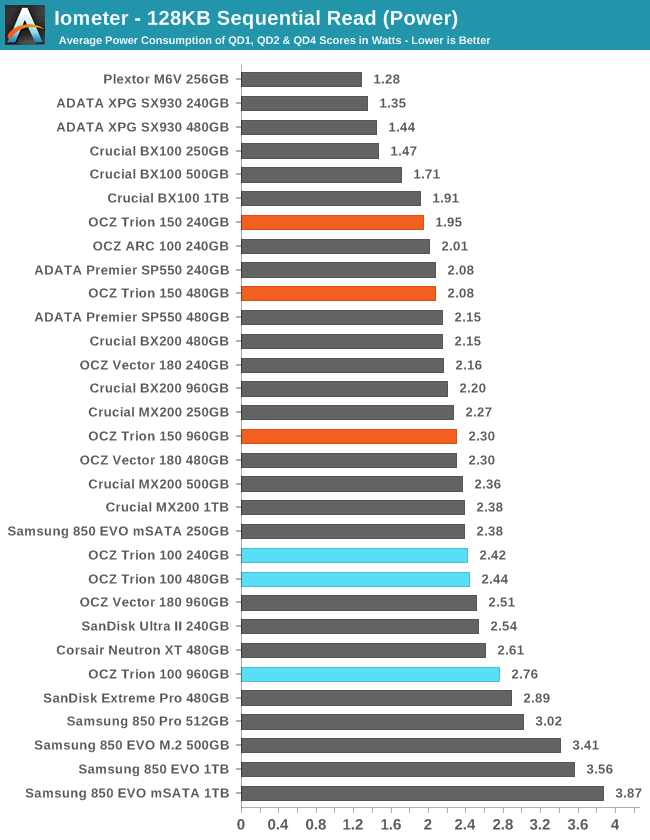
Power consumption is not so tightly clustered, and the larger capacities suffer a bit. All of the Trion 150s require less power than all of the Trion 100s.
 |
|||||||||
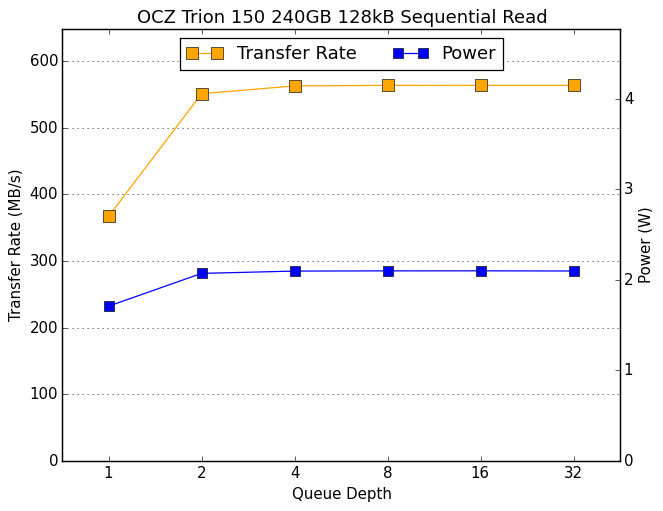
The queue depth scaling behavior for sequential reads on the Trion 150 is very typical, with full performance and power consumption reached at QD2 or larger.
Sequential Write Performance
The sequential write test writes 128kB blocks and tests queue depths ranging from 1 to 32. The queue depth is doubled every three minutes, for a total test duration of 18 minutes. The test spans the entire drive, and the drive is filled before the test begins. The primary score we report is an average of performances at queue depths 1, 2 and 4, as client usage typically consists mostly of low queue depth operations.
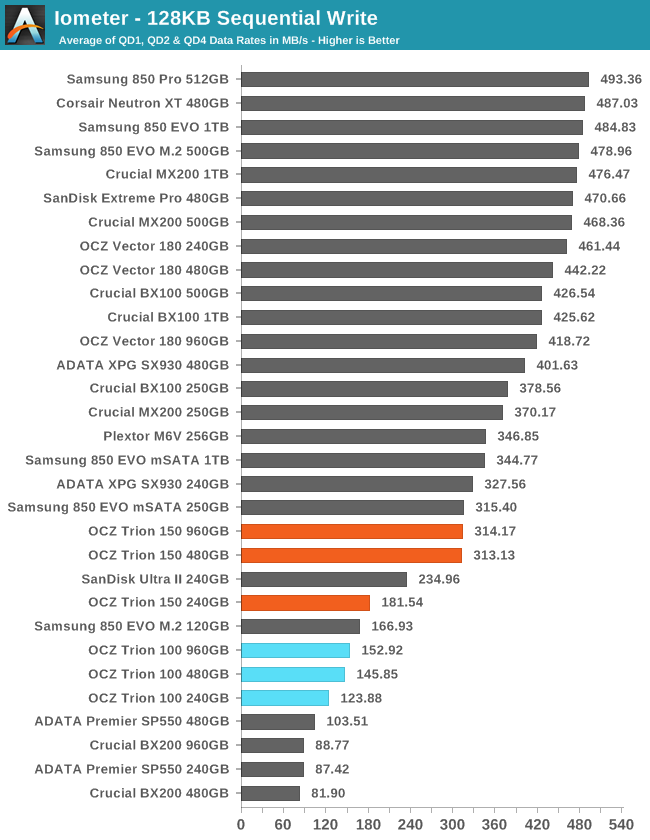
The Trion 150 greatly improves on its predecessor's sequential write speeds, but TLC drives still pay a penalty. The 240GB model's improvement is good but far short of the performance doubling achieved by the larger capacities.
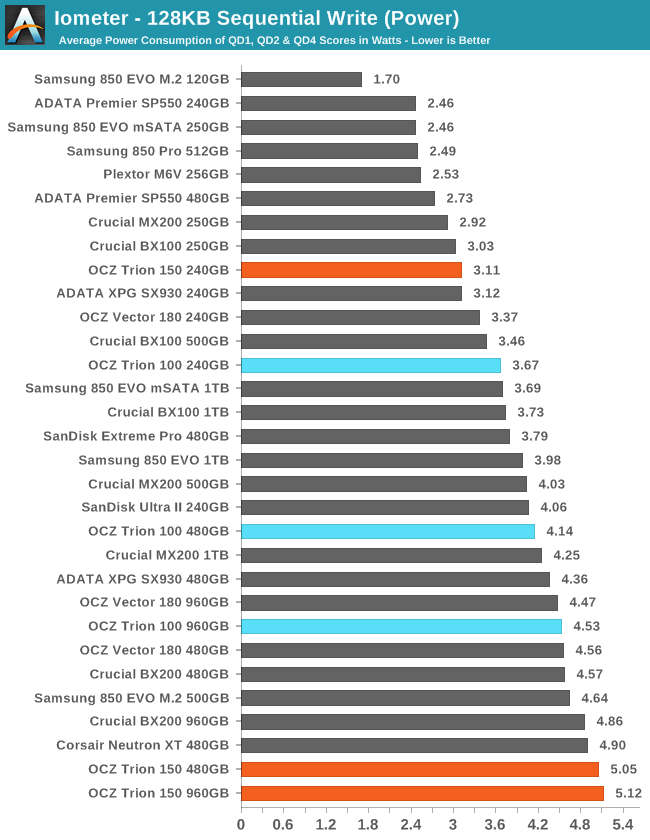
The 240GB Trion 150 manages a modest power improvement over the Trion 100 despite the former delivering much better performance. The larger capacities also improve in efficiency, but still manage to draw more power than anything else.
 |
|||||||||
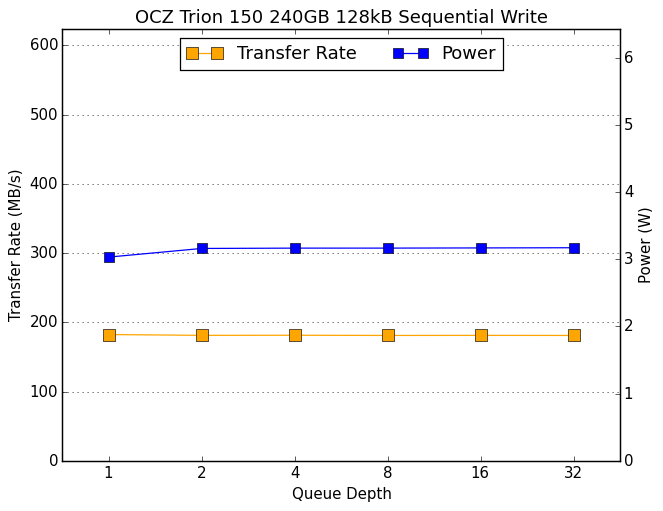
Power usage and performance during sustained sequential writes are almost completely independent of queue depth. The 480GB and 960GB Trion 150s do exhibit modest performance improvement between QD1 and QD2, but things are stable after that.


79 Comments
View All Comments
Hulk - Saturday, April 2, 2016 - link
So I might be doing this calc wrong but I'm seeing the endurance as 250 drive writes? Probably fine for most people and definitely for a media storage drive. Prices are getting low enough for that.stephenbrooks - Saturday, April 2, 2016 - link
I'd prefer it if they just stated endurance in drive writes rather than as 9,876PB or something. I end up doing the mental arithmetic to divide it down to drive writes every time I see that in the table anyway.nikon133 - Monday, April 4, 2016 - link
I got one 480GB Trion 100 for my old Elitebook upgrade.I knew what I'm buying and I am very pleased with it. Here in NZ, I paid 480GB Trion around NZ$30 more than what I would pay for 250GB Samsug 850 EVO (non-pro): they were NZ$150 and 180. I wanted more capacity but didn't want to overspend for machine I rarely use these days.
While it is slow for SSD, it still is revelation in everyday use, compared to HDD. Windows 10 boot time is quick anyway, and SSD takes away all that after-login sluggishness while system is still loading background processes/drivers/utils/...
Like I said, champ it is not, but huge improvement over HDD it is.
SeanJ76 - Tuesday, April 5, 2016 - link
Your pretty damn poor if you can't afford a Intel SSD. Intel will always make the best SSD on the market, they've been in the business the longest!xrror - Wednesday, April 6, 2016 - link
I'm sure glad that brand loyalty makes you a consumer retard. Never compare, never revisit your set opinions. Way to be a true patriot. =(nikon133 - Monday, April 11, 2016 - link
Well said.slowdemon21 - Friday, April 29, 2016 - link
I'm using in PS4 with great resultsprefereduser - Friday, June 3, 2016 - link
OCZ Trion 150 SSD 120GB benchmarks Athon II x4 845 4 GB ramWindows 10 clean install on a Sata III port .
Seq R/W is 130.30 MB/s and 107.29 MB/s respectively
4K = 15.37 MB/s read and 20.71 MB/s
4K -64 Thrd read = 25.55 MB/s write = 52.01 MB/s
Acc. time = 0.274ms read and 0.141ms write
I was looking for more than that (maybe twice or more on seq r/w at least ) but not as much as the i7 test box here even though this is low end part .
OTOH it feels *a lot faster the the not old 1TB 5700 rpm metal hdd ever did and def rag is disabled in windows 10 . .
What you think?
hp79 - Wednesday, September 21, 2016 - link
Is this different from OCZ TR150 (current model)? Looking at the specification of the 480GB on their website (https://ocz.com/us/ssd/tr150-ssd#specs), they are quite different from the TRION 150 480GB in this table. The 4K Write shows up to 83K IOPS instead of the 54K IOPS shown in the table. Others numbers are close though.I have a Trion 150 480GB which I paid $60 at Frys during an awesome sale (probably pricing error). Working very well for my laptop working as a HTPC/home file server.