The OCZ Trion 150 SSD Review
by Billy Tallis on April 1, 2016 8:00 AM ESTMixed Random Read/Write Performance
The mixed random I/O benchmark starts with a pure read test and gradually increases the proportion of writes, finishing with pure writes. The queue depth is 3 for the entire test and each subtest lasts for 3 minutes, for a total test duration of 18 minutes. As with the pure random write test, this test is restricted to a 16GB span of the drive, which is empty save for the 16GB test file.
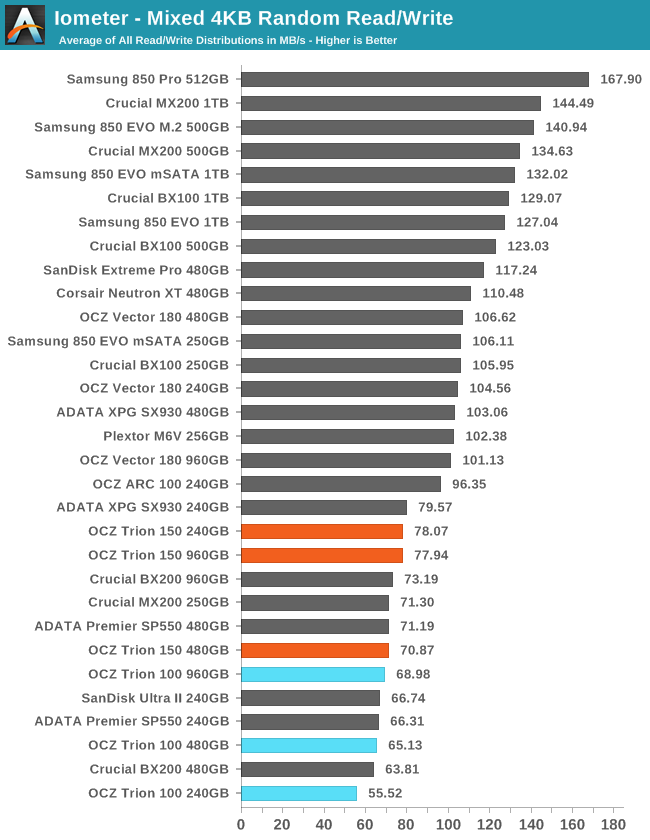
The 240GB Trion 150 once again shows surprising improvement compared to both its predecessor and its larger siblings, and all capacities handle the mixed random workload as well as any budget TLC drive.
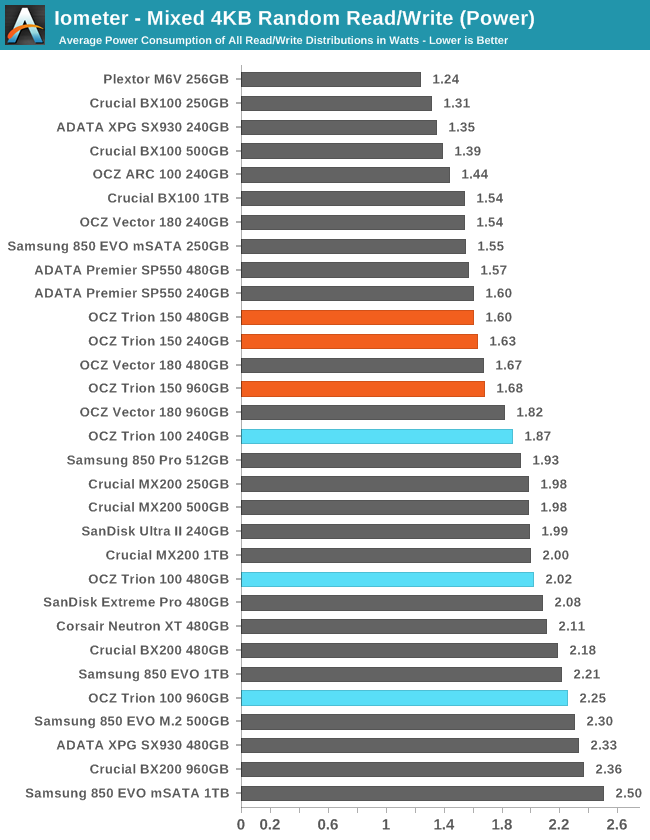
The Trion 150 shows less variation in power consumption across capacities, and better efficiency than the competition.
 |
|||||||||
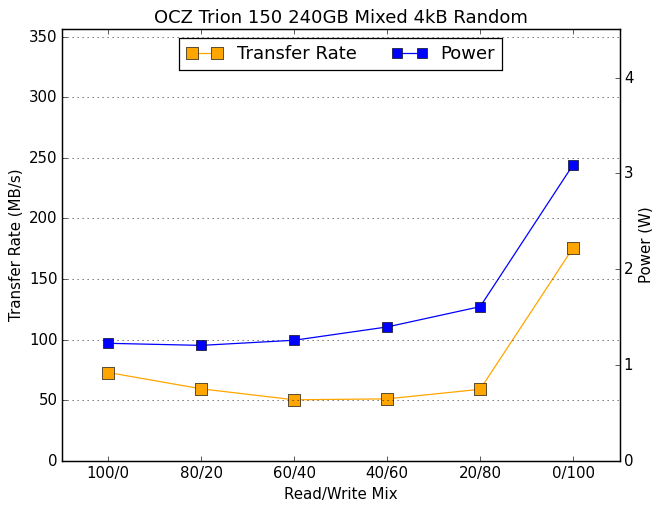
The 240GB Trion 150's relatively impressive score is due mostly to the good performance on the pure write phase at the end of this test. The larger capacities don't benefit quite as much at the end, but do score slightly higher on the other portions of the test.
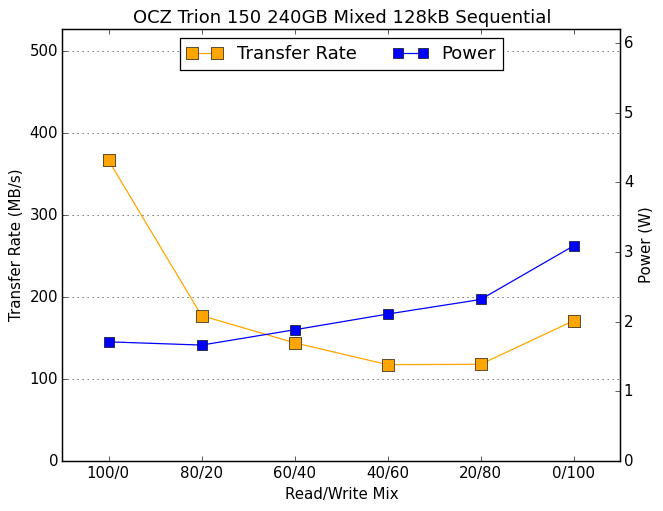
Mixed Sequential Read/Write Performance
The mixed sequential access test covers the entire span of the drive and uses a queue depth of one. It starts with a pure read test and gradually increases the proportion of writes, finishing with pure writes. Each subtest lasts for 3 minutes, for a total test duration of 18 minutes. The drive is filled before the test starts.
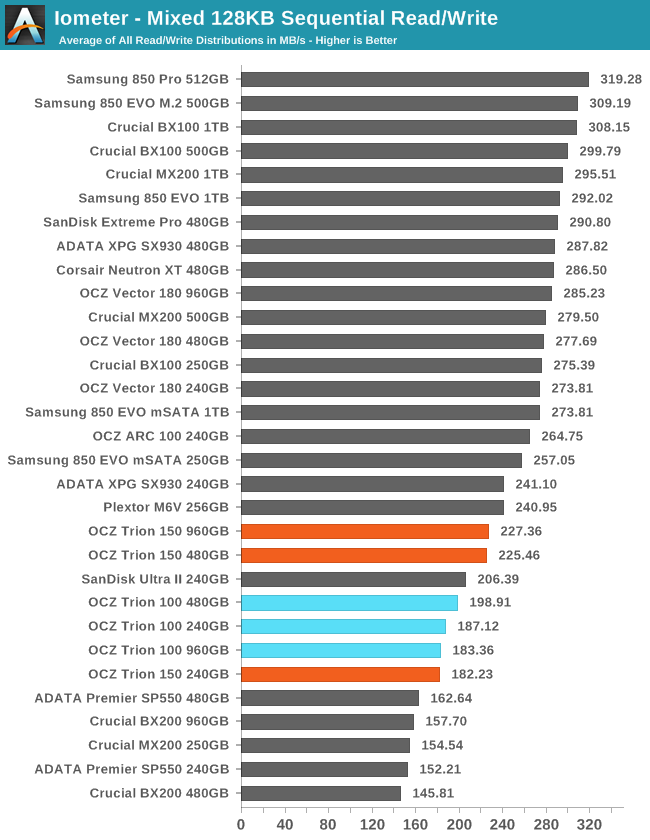
The 240GB Trion 150 is barely slower than its predecessor on the mixed sequential test, but the larger capacities perform much better and are close to matching the slowest MLC drives.
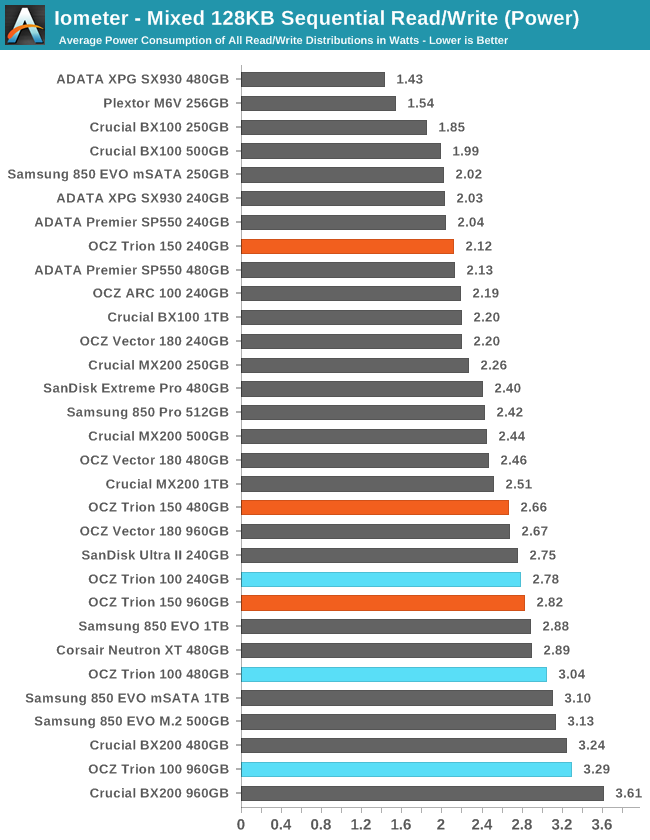
The Trion 150 continues to show improved power efficiency compared to the Trion 100, and once again manages to beat the other planar TLC drives.
 |
|||||||||
Quite differently from the mixed random test, on this test the 240GB Trion 150's score is hurt by the performance on the pure write phase. All three capacities manage to show a performance spike at the end of the test, which is absent from the worst scoring drives.


79 Comments
View All Comments
Hulk - Saturday, April 2, 2016 - link
So I might be doing this calc wrong but I'm seeing the endurance as 250 drive writes? Probably fine for most people and definitely for a media storage drive. Prices are getting low enough for that.stephenbrooks - Saturday, April 2, 2016 - link
I'd prefer it if they just stated endurance in drive writes rather than as 9,876PB or something. I end up doing the mental arithmetic to divide it down to drive writes every time I see that in the table anyway.nikon133 - Monday, April 4, 2016 - link
I got one 480GB Trion 100 for my old Elitebook upgrade.I knew what I'm buying and I am very pleased with it. Here in NZ, I paid 480GB Trion around NZ$30 more than what I would pay for 250GB Samsug 850 EVO (non-pro): they were NZ$150 and 180. I wanted more capacity but didn't want to overspend for machine I rarely use these days.
While it is slow for SSD, it still is revelation in everyday use, compared to HDD. Windows 10 boot time is quick anyway, and SSD takes away all that after-login sluggishness while system is still loading background processes/drivers/utils/...
Like I said, champ it is not, but huge improvement over HDD it is.
SeanJ76 - Tuesday, April 5, 2016 - link
Your pretty damn poor if you can't afford a Intel SSD. Intel will always make the best SSD on the market, they've been in the business the longest!xrror - Wednesday, April 6, 2016 - link
I'm sure glad that brand loyalty makes you a consumer retard. Never compare, never revisit your set opinions. Way to be a true patriot. =(nikon133 - Monday, April 11, 2016 - link
Well said.slowdemon21 - Friday, April 29, 2016 - link
I'm using in PS4 with great resultsprefereduser - Friday, June 3, 2016 - link
OCZ Trion 150 SSD 120GB benchmarks Athon II x4 845 4 GB ramWindows 10 clean install on a Sata III port .
Seq R/W is 130.30 MB/s and 107.29 MB/s respectively
4K = 15.37 MB/s read and 20.71 MB/s
4K -64 Thrd read = 25.55 MB/s write = 52.01 MB/s
Acc. time = 0.274ms read and 0.141ms write
I was looking for more than that (maybe twice or more on seq r/w at least ) but not as much as the i7 test box here even though this is low end part .
OTOH it feels *a lot faster the the not old 1TB 5700 rpm metal hdd ever did and def rag is disabled in windows 10 . .
What you think?
hp79 - Wednesday, September 21, 2016 - link
Is this different from OCZ TR150 (current model)? Looking at the specification of the 480GB on their website (https://ocz.com/us/ssd/tr150-ssd#specs), they are quite different from the TRION 150 480GB in this table. The 4K Write shows up to 83K IOPS instead of the 54K IOPS shown in the table. Others numbers are close though.I have a Trion 150 480GB which I paid $60 at Frys during an awesome sale (probably pricing error). Working very well for my laptop working as a HTPC/home file server.