The Western Digital Black PCIe SSD (512GB) Review
by Billy Tallis on March 8, 2017 8:30 AM ESTRandom Read Performance
The random read test requests 4kB blocks and tests queue depths ranging from 1 to 32. The queue depth is doubled every three minutes, for a total test duration of 18 minutes. The test spans the entire drive, which is filled before the test starts. The primary score we report is an average of performances at queue depths 1, 2 and 4, as client usage typically consists mostly of low queue depth operations.
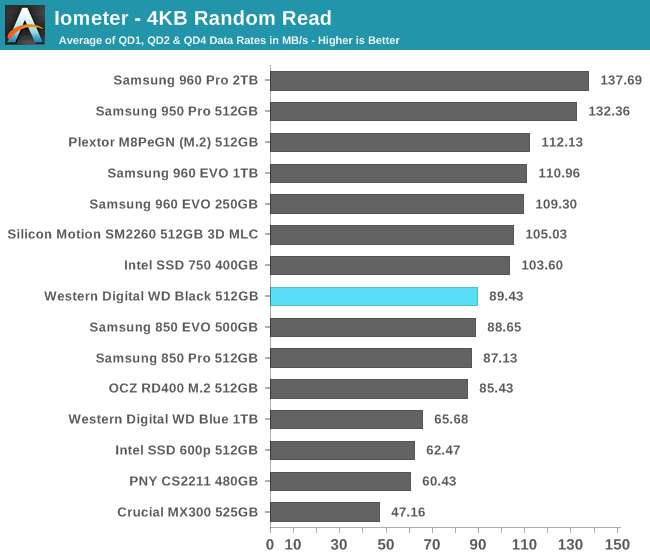
The WD Black just barely manages to deliver better random read performance than any SATA SSD, and among PCIe SSDs it also slightly beats the OCZ RD400 in addition to outperforming the Intel 600p as usual.
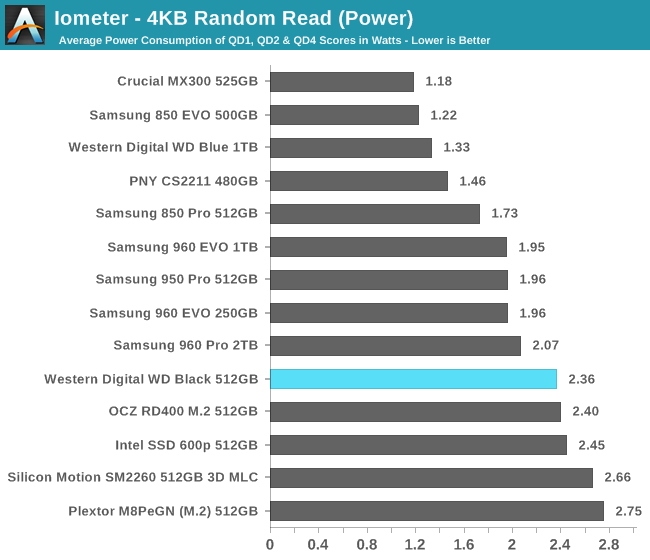
The WD Black's power consumption is the lowest among the non-Samsung PCIe SSDs, but its efficiency is still below average when SATA SSDs are considered, and it's only half as efficient as the Samsung 850 EVO.
 |
|||||||||
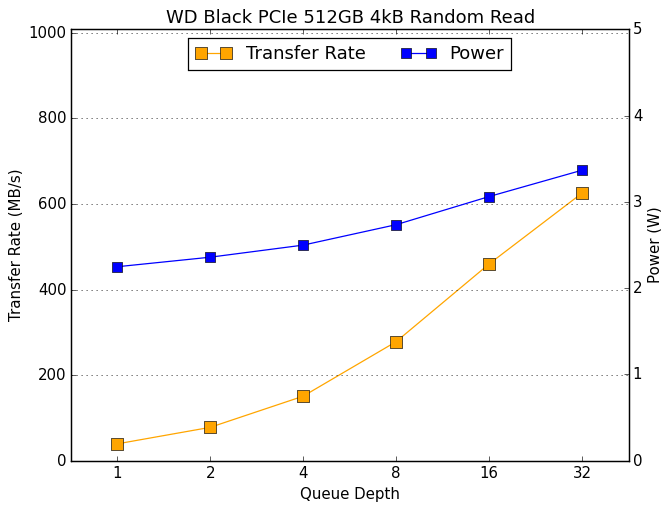
The WD Black has only a narrow random read performance advantage over SATA SSDs at low queue depths, but by QD16 it has scaled beyond the performance limits of the SATA interface. Power consumption starts out high but does not increase particularly steeply as the test progresses.
Random Write Performance
The random write test writes 4kB blocks and tests queue depths ranging from 1 to 32. The queue depth is doubled every three minutes, for a total test duration of 18 minutes. The test is limited to a 16GB portion of the drive, and the drive is empty save for the 16GB test file. The primary score we report is an average of performances at queue depths 1, 2 and 4, as client usage typically consists mostly of low queue depth operations.
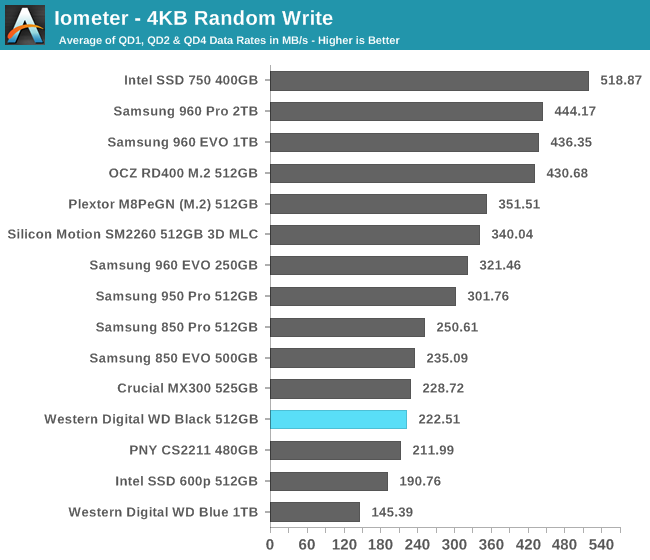
The random write performance of the WD Black is nothing special: it's much faster than the SATA-based WD Blue, but still not as fast as the SATA drives using 3D NAND.
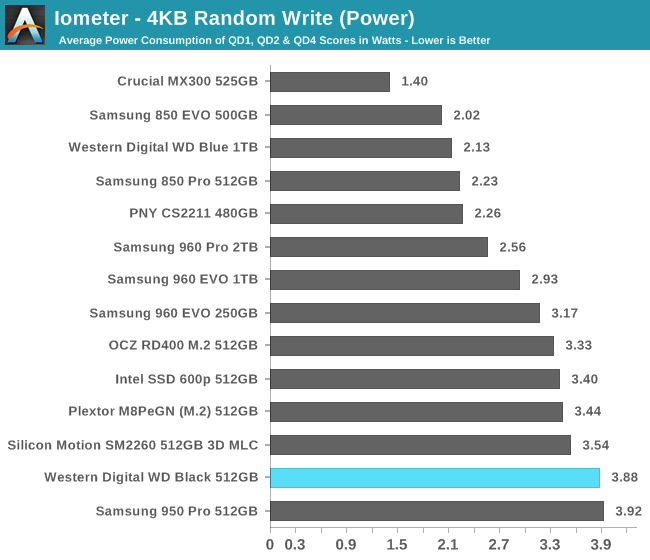
The power consumption of the WD Black is the second highest we've measured for this test and is close to 4W even at low queue depths. The efficiency is half that of the Samsung 850 EVO and barely a third that of the Crucial MX300.
 |
|||||||||
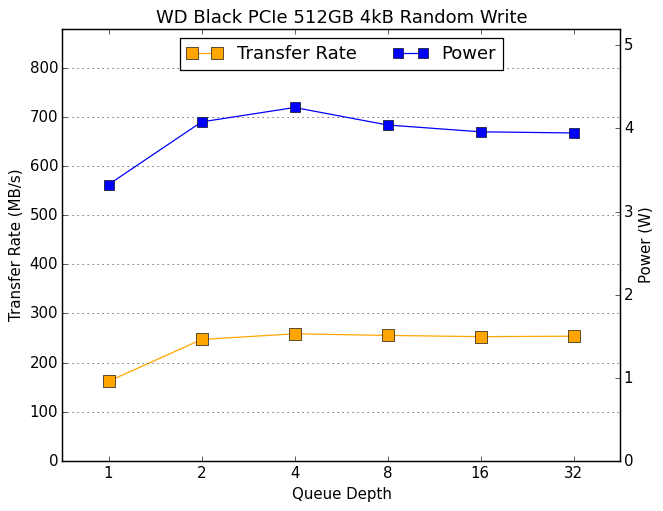
The WD Black is probably thermally limited in the second half of the test as power consumption drops back below 4W and performance ceases to increase with queue depth.


36 Comments
View All Comments
dgingeri - Wednesday, March 8, 2017 - link
At least they priced it about right. It's more expensive than the Intel 600p, but far less expensive than the 960 EVO and slightly less expensive than the M8Pe. This part of the market is odd. Usually, the fastest performing parts are FAR more expensive for just a small return on performance. In SSDs right now, the differences in price are fairly small, but the differences in performance are huge. I think the 960 EVO is about the best deal for a SSD, and this thing is just a shame to the "Black" label.Guspaz - Wednesday, March 8, 2017 - link
So, the product called "WD Black" is coloured blue, but there is also a "WD Blue" product? Let me guess, that one has a black PCB?Gasaraki88 - Wednesday, March 8, 2017 - link
Nope, it would have made sense if they spent the money to use a black pcb for the black drive, a blue pcb for the blue drive and the green pcb for the green drive. Nope.This drive gives the "Black" label a bad name anyway.
MrSpadge - Wednesday, March 8, 2017 - link
They probably thought "our Black HDDs are really slow nowadays, with all those budget SSDs around, so let's call a barely-not-too-slow SSD: BLACK".madspartus - Wednesday, March 8, 2017 - link
WD Black: planar 15 nm TLC NANDI'll be sure to remember that WD doesn't give a shit about the quality and performance of their products and branding. Way to dilute the brand, hope the short term gains are worth it.
shabby - Wednesday, March 8, 2017 - link
The branding is fine, the wd green ssd will be a qlc nand drive.bug77 - Thursday, March 9, 2017 - link
True, black has always been the performance line, it shouldn't go on any TLC parts. Not even on 3D TLC.romrunning - Wednesday, March 8, 2017 - link
On your Storage Bench - Light (Latency) graph, you show the Intel 750 and Patriot Hellfire on top despite the Samsung drives beating them both in "Full" condition. So if they tie on the empty drive score, the Samsungs should be on top due to their full drive latency.Gasaraki88 - Wednesday, March 8, 2017 - link
How come you didn't test any drives that use the Phison E7 controllers? Patriot Hellfire, MyDigitalSSD BPX, and Corsair Force?BrokenCrayons - Wednesday, March 8, 2017 - link
This certainly isn't an impressive product.