The Intel 12th Gen Core i9-12900K Review: Hybrid Performance Brings Hybrid Complexity
by Dr. Ian Cutress & Andrei Frumusanu on November 4, 2021 9:00 AM ESTCPU Tests: SPEC MT Performance - P and E-Core Scaling
Update Nov 6th:
We’ve finished our MT breakdown for the platform, investigating the various combination of cores and memory configurations for Alder Lake and the i9-12900K. We're posting the detailed scores for the DDR5 results, following up the aggregate results for DDR4 as well.
The results here solely cover the i9-12900K and various combinations of MT performance, such as 8 E-cores, 8 P-cores with 1T as well as 2T, and the full 24T 8P2T+8E scenario. The results here were done on Linux due to easier way to set affinities to the various cores, and they’re not completely comparable to the WSL results on the previous page, however should be within small margins of error for most tests.
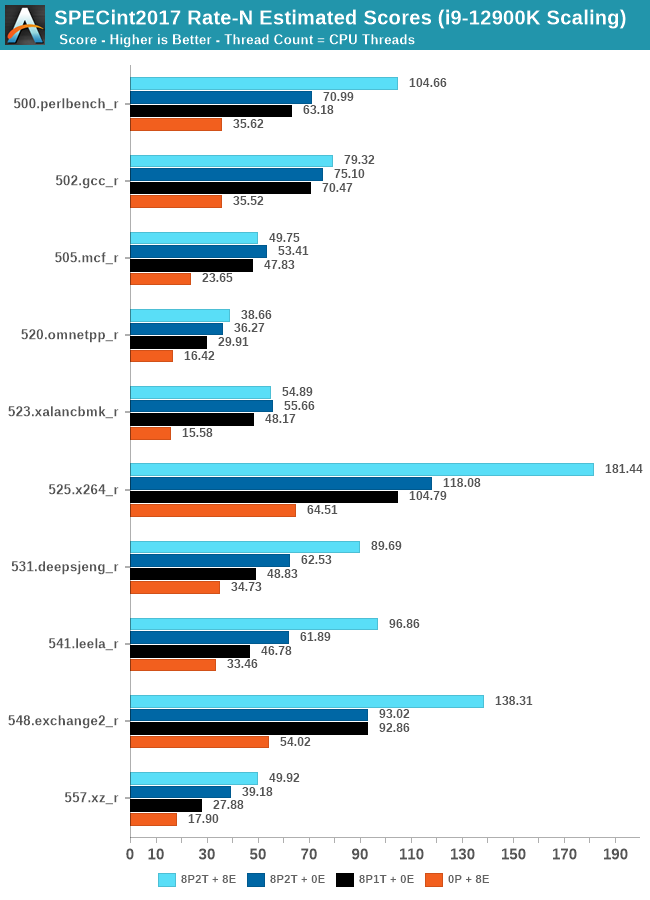
In the integer suite, the E-cores are quite powerful, reaching scores of around 50% of the 8P2T results, or more.
Many of the more core-bound workloads appear to very much enjoy just having more cores added to the suite, and these are also the workloads that have the largest gains in terms of gaining performance when we add 8 E-cores on top of the 8P2T results.
Workloads that are more cache-heavy, or rely on memory bandwidth, both shared resources on the chip, don’t scale too well at the top-end of things when adding the 8 E-cores. Most surprising to me was the 502.gcc_r result which barely saw any improvement with the added 8 E-cores.
More memory-bound workloads such as 520.omnetpp or 505.mcf are not surprising to see them not scale with the added E-cores – mcf even seeing a performance regression as the added cores mean more memory contention on the L3 and memory controllers.
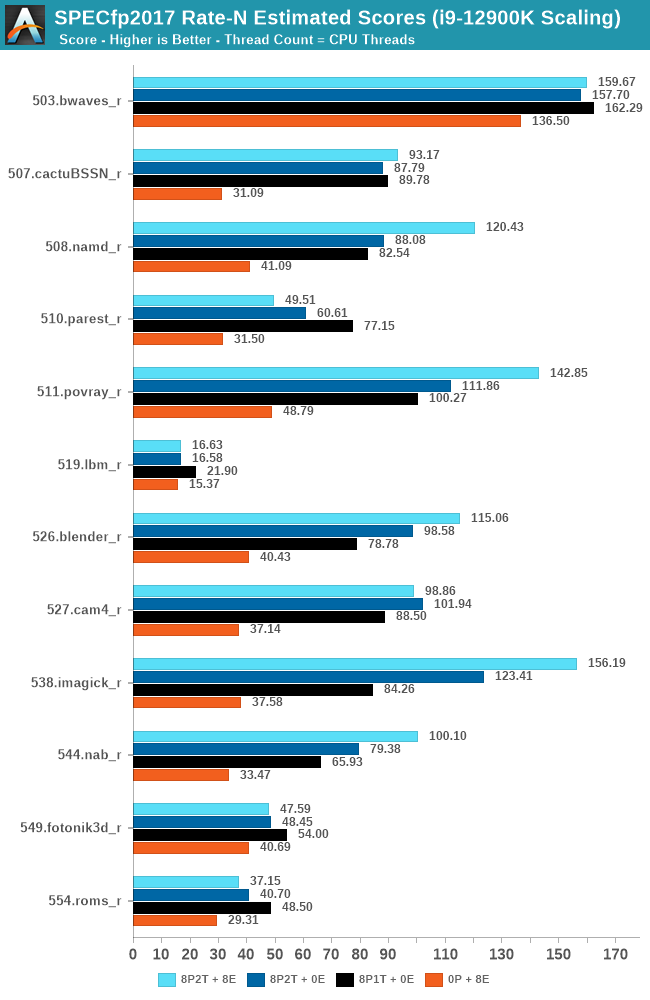
In the FP suite, the E-cores more clearly showcase a lower % of performance relative to the P-cores, and this makes sense given their design. Only few more compute-bound tests, such as 508.namd, 511.povray, or 538.imagick see larger contributions of the E-cores when they’re added in on top of the P-cores.
The FP suite also has a lot more memory-hungry workload. When it comes to DRAM bandwidth, having either E-cores or P-cores doesn’t matter much for the workload, as it’s the memory which is bottlenecked. Here, the E-cores are able to achieve extremely large performance figures compared to the P-cores. 503.bwaves and 519.lbm for example are pure DRAM bandwidth limited, and using the E-cores in MT scenarios allows for similar performance to the P-cores, however at only 35-40W package power, versus 110-125W for the P-cores result set.
Some of these workloads also see regressions in performance when adding in more cores or threads, as it just means more memory traffic contention on the chip, such as seen in the 8P2T+8E, 8P2T regressions over the 8P1T results.
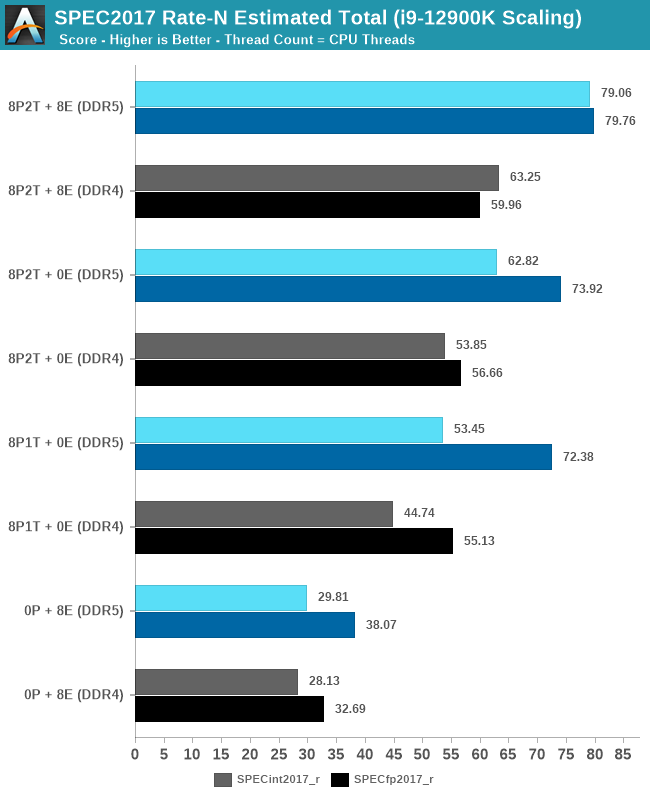
What’s most interesting here is the scaling of performance and the attribution between the P-cores and the E-cores. Focusing on the DDR5 set, the 8 E-cores are able to provide around 52-55% of the performance of 8 P-cores without SMT, and 47-51% of the P-cores with SMT. At first glance this could be argued that the 8P+8E setup can be somewhat similar to a 12P setup in MT performance, however the combined performance of both clusters only raises the MT scores by respectively 25% in the integer suite, and 5% in the FP suite, as we are hitting near package power limits with just 8P2T, and there’s diminishing returns on performance given the shared L3. What the E-cores do seem to allow the system is to allows to reduce every-day average power usage and increase the efficiency of the socket, as less P-cores need to be active at any one time.


474 Comments
View All Comments
Spunjji - Friday, November 5, 2021 - link
N7 is a little more dense than Intel's 10nm-class process - 15-20% in comparable product lines (e.g. Renoir vs. Ice Lake, Lakefield vs. Zen 3 compute chiplet). There is no indication that Intel 7 is more dense than previous iterations of 10nm. N7 also appears to have better power characteristics.It's difficult to tell, though, because Intel are pushing much harder on clock speeds than AMD and have a wider core design, both of which would increase power draw even on an identical process.
Blastdoor - Thursday, November 4, 2021 - link
I’m a little surprised by the low level of attention to performance/watt in this review. ArsTechnica gave a bit more info in that regard, and Alder Lake looks terrible on performance/watt.If Intel had achieved this performance with similar efficiency to AMD I would have bought Intel stock today.
But the efficiency numbers here are truly awful. I can see why this is being released as an enthusiast desktop processor -- that's the market where performance/watt matters least. In the mobile and data center markets (ie, the Big markets), these efficiency numbers are deal breakers. AMD appears to have nothing to fear from Intel in the markets that matter most.
meacupla - Thursday, November 4, 2021 - link
Yeah, the power consumption of 12900K is quite bad.From other reviews, it's pretty clear that highest end air cooling is not enough for 12900K, and you will need a thick 280mm or 360mm water cooler to keep 12900K cool.
Ian Cutress - Thursday, November 4, 2021 - link
I think there are some issues with temperature readings on ADL. A lot of software showcases 100C with only 3 P-cores loaded, but even with all cores loaded, the CPU doesn't de-clock at that temp. My MSI AIO has a temperature display, and it only showed 75C at load. I've got questions out in a few places - I think Intel switched some of the thermal monitoring stuff inside and people are polling the wrong things. Other press are showing 100C quite easily too. I'm asking MSI how their AIO had 75C at load, but I'm still waiting on an answer. An ASUS rep said that 75-80C should be normal under load. So why everything is saying 100C I have no idea.Blastdoor - Thursday, November 4, 2021 - link
Note that the ArsTechnica review looks at power draw from the wall, so unaffected by sensor issues.jamesjones44 - Thursday, November 4, 2021 - link
They also show the 5900x somehow drawing more power than a 5950x at full load. While I'm sure Intel is drawing more power, I question their testing methods given we know there is very little chance of a 5950x fully loaded drawing less than a 5900x unless they won or lost the CPU lottery.TheinsanegamerN - Thursday, November 4, 2021 - link
techspot and TPU also show that, and it has been explained before that the 5950x gets the premium dies and runs at a lower core voltage then the 5900x, thus it pulls less power despite having more cores.haukionkannel - Thursday, November 4, 2021 - link
5950x use better chips than 5900x... that is the reason for power usage!vegemeister - Saturday, November 6, 2021 - link
5950X can hit the current limit when all cores are loaded, so the power consumption folds back.meacupla - Thursday, November 4, 2021 - link
75C reading from the AIO, presumably a reading from the base plate, is quite hot, I must say.