Upgrading from an Intel Core i7-2600K: Testing Sandy Bridge in 2019
by Ian Cutress on May 10, 2019 10:30 AM EST- Posted in
- CPUs
- Intel
- Sandy Bridge
- Overclocking
- 7700K
- Coffee Lake
- i7-2600K
- 9700K
CPU Performance: Office Tests
The Office test suite is designed to focus around more industry standard tests that focus on office workflows, system meetings, some synthetics, but we also bundle compiler performance in with this section. For users that have to evaluate hardware in general, these are usually the benchmarks that most consider.
All of our benchmark results can also be found in our benchmark engine, Bench.
PCMark 10: Industry Standard System Profiler
Futuremark, now known as UL, has developed benchmarks that have become industry standards for around two decades. The latest complete system test suite is PCMark 10, upgrading over PCMark 8 with updated tests and more OpenCL invested into use cases such as video streaming.
PCMark splits its scores into about 14 different areas, including application startup, web, spreadsheets, photo editing, rendering, video conferencing, and physics. We post all of these numbers in our benchmark database, Bench, however the key metric for the review is the overall score.
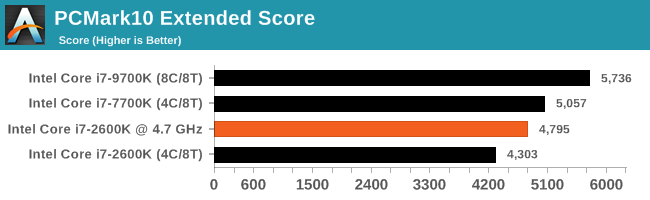
Something like PCMark doesn't really show the scale of the differences, except in the main tests that are fully multithreaded where the 9700K pulls out a bigger lead. The 7700K only has a 17% lead over the 2600K, which goes down to 5% when compared to the overclocked version. This is perhaps more of an indication of how often you might feel the difference with a new 7700K over an overclocked 2600K: 5% of the time. It depends on your load balance, of course.
Chromium Compile: Windows VC++ Compile of Chrome 56
A large number of AnandTech readers are software engineers, looking at how the hardware they use performs. While compiling a Linux kernel is ‘standard’ for the reviewers who often compile, our test is a little more varied – we are using the windows instructions to compile Chrome, specifically a Chrome 56 build from March 2017, as that was when we built the test. Google quite handily gives instructions on how to compile with Windows, along with a 400k file download for the repo.
In our test, using Google’s instructions, we use the MSVC compiler and ninja developer tools to manage the compile. As you may expect, the benchmark is variably threaded, with a mix of DRAM requirements that benefit from faster caches. Data procured in our test is the time taken for the compile, which we convert into compiles per day.

Our compile test in this case loves the cores of the 9700K over SMT, but in this case we again see the overclocked 2600K get inbetween the 7700K and the 2600K at stock. Even without an overclock on the 7700K, that's an easy gain to amortize.
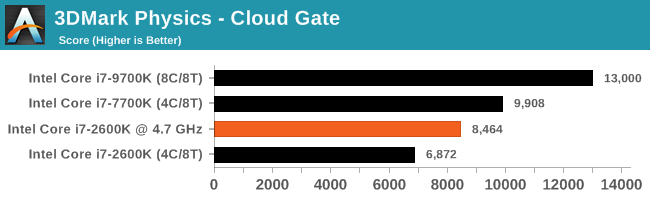
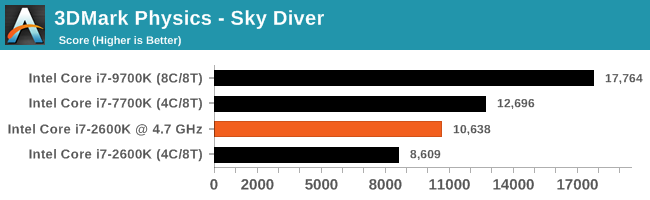
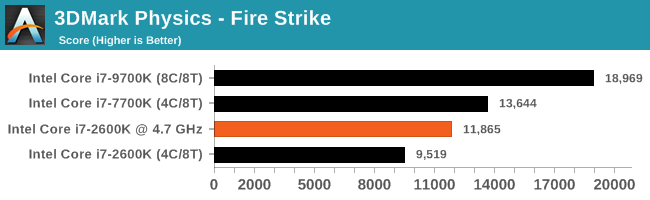
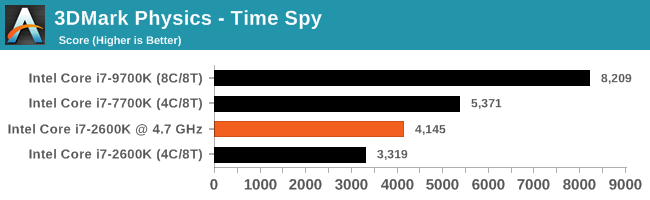
3DMark Physics: In-Game Physics Compute
Alongside PCMark is 3DMark, Futuremark’s (UL’s) gaming test suite. Each gaming tests consists of one or two GPU heavy scenes, along with a physics test that is indicative of when the test was written and the platform it is aimed at. The main overriding tests, in order of complexity, are Ice Storm, Cloud Gate, Sky Diver, Fire Strike, and Time Spy.

Some of the subtests offer variants, such as Ice Storm Unlimited, which is aimed at mobile platforms with an off-screen rendering, or Fire Strike Ultra which is aimed at high-end 4K systems with lots of the added features turned on. Time Spy also currently has an AVX-512 mode (which we may be using in the future).
For our tests, we report in Bench the results from every physics test, but for the sake of the review we keep it to the most demanding of each scene: Ice Storm Unlimited, Cloud Gate, Sky Diver, Fire Strike Ultra, and Time Spy.
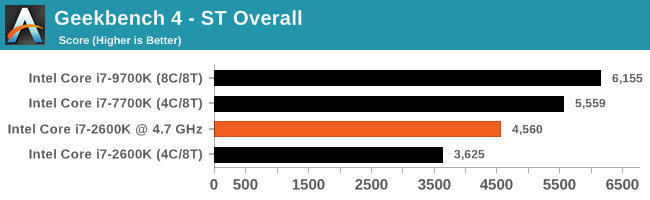
GeekBench4: Synthetics
A common tool for cross-platform testing between mobile, PC, and Mac, GeekBench 4 is an ultimate exercise in synthetic testing across a range of algorithms looking for peak throughput. Tests include encryption, compression, fast Fourier transform, memory operations, n-body physics, matrix operations, histogram manipulation, and HTML parsing.
I’m including this test due to popular demand, although the results do come across as overly synthetic, and a lot of users often put a lot of weight behind the test due to the fact that it is compiled across different platforms (although with different compilers).
We record the main subtest scores (Crypto, Integer, Floating Point, Memory) in our benchmark database, but for the review we post the overall single and multi-threaded results.


213 Comments
View All Comments
djayjp - Friday, May 10, 2019 - link
Hey, I know! Let's benchmark a CPU at 4K+ using a mid-range GPU! Brilliant....Ian Cutress - Friday, May 10, 2019 - link
Guess what, there are gaming benchmarks at a wide range of resolutions!eva02langley - Friday, May 10, 2019 - link
I am not sure what is the goal of this? Is it for saying that Sandy Bridge is still relevant, Intel IPC is bad or games developers are lazy?One thing for sure, it is time to move on from GTA V. You cannot get anything from those numbers.
Times to have games that are from 2018 and 2019 only. You cannot just bench old games so your database can be built upon. It doesn't represent the consumer reality.
BushLin - Saturday, May 11, 2019 - link
Yeah, why benchmark a game where the results can be compared against all GPUs and CPUs from the last decade. </s>StevoLincolnite - Sunday, May 12, 2019 - link
GTA 5 is still demanding.Millions of gamers still play GTA 5.
It is one of the most popular games of all time.
Ergo... It is entirely relevant having GTA 5 benchies.
djayjp - Friday, May 10, 2019 - link
Then the GPU is still totally relevant.MDD1963 - Saturday, May 11, 2019 - link
Of course it is....; no one plays at 720P anymore....PeachNCream - Sunday, May 12, 2019 - link
I'd argue that hardly anyone ever played PC games at that resolution. 720p is 1280x720. Computer screens went from 4:3 resolutions to 16:10 and when that was the case, most commonly the lower resolution panels were 1280x800. When 16:9 ended up taking over, the most common lower resolution was 1366x768. Very few PC monitors were ever actually hit 720p. Even most of the low res cheap TVs out there were 1366 or 1360x768.Zoomer - Friday, June 14, 2019 - link
Doesn't matter, the performance will be similar.fep_coder - Friday, May 10, 2019 - link
My threshold for a CPU upgrade has always been 2x performance increase. It's sad that it took this many generations of CPUs to get near that point. Almost all of the systems in my upgrade chain (friends and family) are Sandy Bridge based. I guess that it's finally time to start spending money again.