The Intel Core i3-7350K (60W) Review: Almost a Core i7-2600K
by Ian Cutress on February 3, 2017 8:00 AM ESTLegacy and Synthetic Tests
At AnandTech, I’ve taken somewhat of a dim view to pure synthetic tests, as they fail to be relatable. Nonetheless, our benchmark database spans to a time when that is all we had! We take a few of these tests for a pin with the latest hardware.
Cinebench R10
The R10 version of Cinebench is one of our oldest benchmarks, with data going back more than a few generations. The benchmark is similar to that of the newest R15 version, albeit with a simpler render target and a different strategy for multithreading.
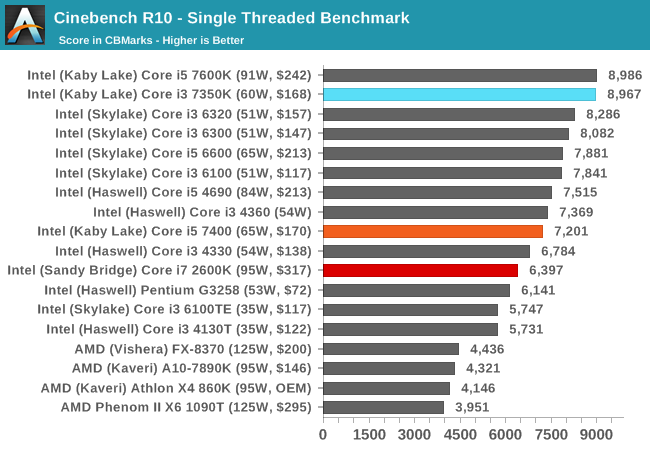
With high frequency in tow, the Core i3-7350K makes its mark.
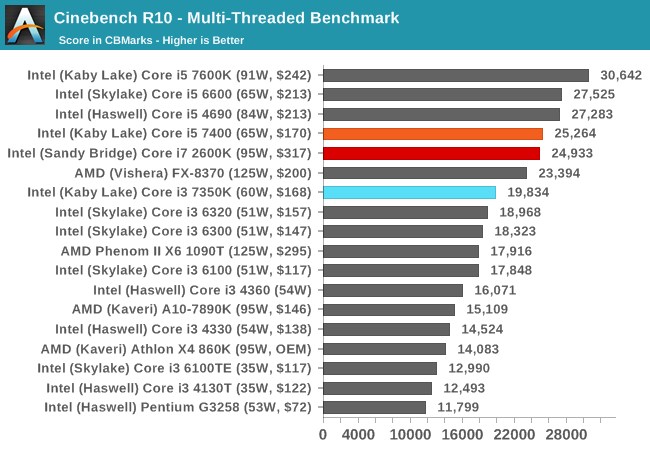
When more threads come to play, the Core i5-7400 and Core i7-2600K battle it out in terms of four cores and IPC vs hyperthreading. The Core i3-7350K sits around ~25% behind.
Cinebench R11.5
CB11.5 has been popular for many years as a performance test, using easy to read and compare numbers that aren’t in the 1000s. We run the benchmark in an automated fashion three times in single-thread and multi-thread mode and take the average of the results.
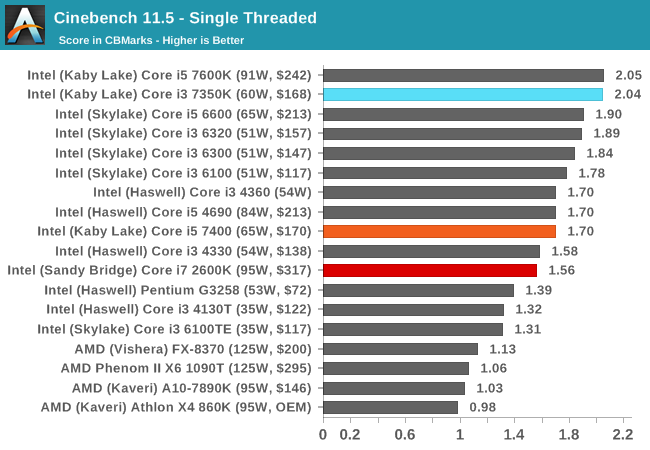
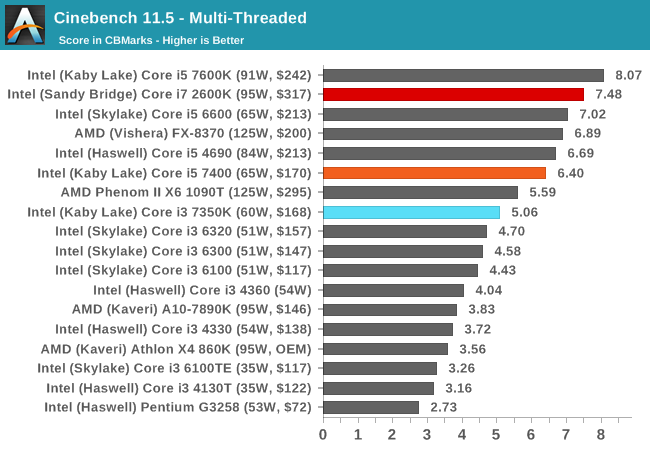
Similar to CB10, the single thread results show that a 4.2 GHz Kaby Lake is nothing to be sniffed at. In the multithreaded test, CB11.5 is more able to leverage the hyperthreads, showing that a Core i7-2600K will run rings around the low end Kaby i5, but is bested by the higher frequency Kaby i5-K. The Core i3 still has that dual core deficit.
7-zip
As an open source compression/decompression tool, 7-zip is easy to test and features a built-in benchmark to measure performance. As a utility, similar to WinRAR, high thread counts, frequency and UPC typically win the day here.
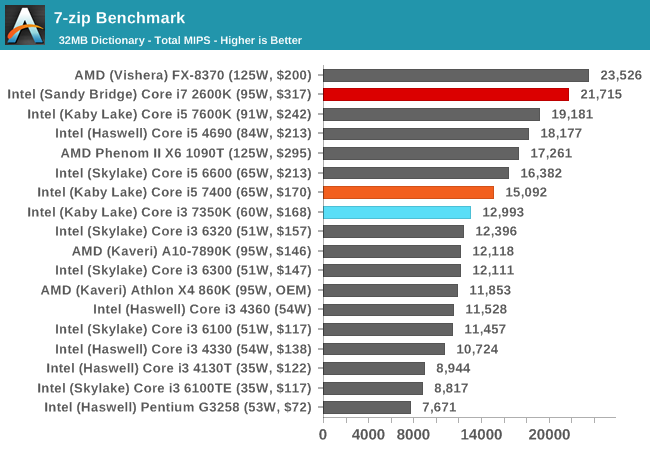
The difference between the i3-7350K and the i5-7400 shows that 7-zip prefers cores over threads, but the Core i7-2600K results show it can use both to good effect, even on older microarchitectures, scoring almost double the i3-7350K.
POV-Ray
Ray-tracing is a typical multithreaded test, with each ray being a potential thread in its own right ensuring that a workload can scale in complexity easily. This lends itself to cores, frequency and IPC: the more, the better.
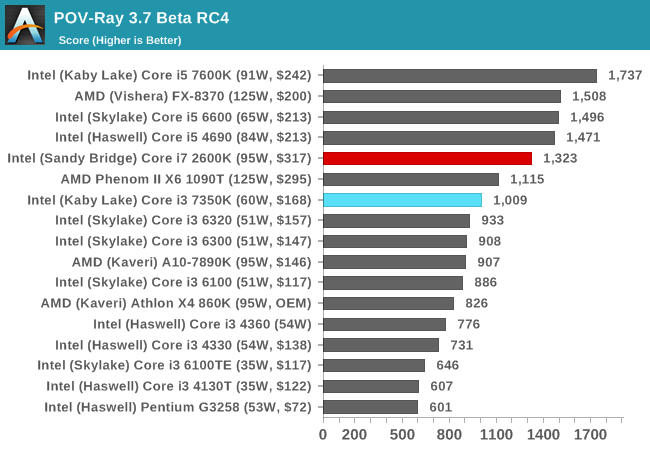
POV-Ray is a benchmark that is usually touted as liking high IPC, high frequency and more threads. The i7-2600K, despite having double the resources of the Core i3-7350K, is only 30% ahead.
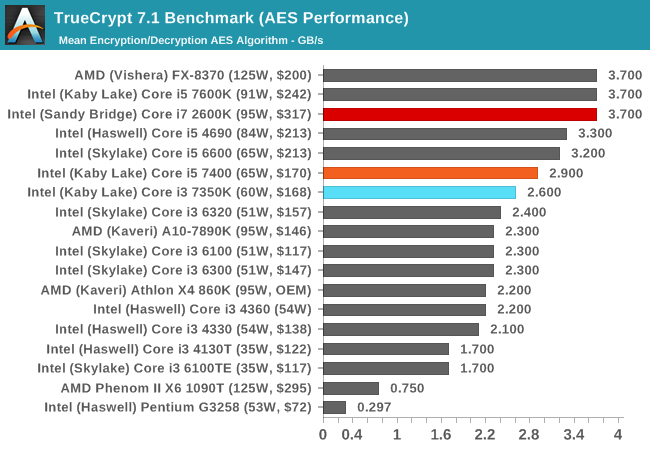
AES via TrueCrypt
Despite TrueCrypt no longer being maintained, the final version incorporates a good test to measure different encryption methodologies as well as encryption combinations. When TrueCrypt was in full swing, the introduction of AES accelerated hardware dialed the performance up a notch, however most of the processors (save the Pentiums/Celerons) now support this and get good speed. The built-in TrueCrypt test does a mass encryption on in-memory data, giving results in GB/s.


186 Comments
View All Comments
Gich - Friday, February 3, 2017 - link
Sure, it's progress... but it used to be much more, much faster... so it doesn't feal progress anymore.StrangerGuy - Friday, February 3, 2017 - link
Things I learned:1. 7350K is hilariously overpriced versus a G4560.
2. Overclocking stock 4.2GHz Intel parts that are already so far from the freq/power sweet spot and little headroom that it's mostly a exercise in futility.
3. That i5 7400 is crazy power efficient.
jaydee - Friday, February 3, 2017 - link
Regarding point #3.It makes you wonder what the "T" designation is really all about. Is the i5-7600T @2.8 - 3.7GHz (35W), basically the same thing as the i5-7400 (65W), only difference being they downclocked the base 200 MHz and upclocked the turbo 200 MHz. On paper you'd expect the "T" to be way more power efficient, but in actuality I bet they are about the same.
Dr. Swag - Friday, February 3, 2017 - link
Hey Ian, correct me if wrong, but couldn't you have just downclocked a 7600k to "simulate" an i5 7400? Afterall, the cache is the same so it should be the same except for the TDP...fanofanand - Friday, February 3, 2017 - link
That would produce a ton of new variables though, i7's theoretically have gone through more exhaustive binning and are a "higher quality" chip that should be able to operate at higher frequencies with lower voltage. Should being an important caveat there.snarfbot - Friday, February 3, 2017 - link
i think microcenter was selling 2600k's for 230 bucks. so 6 years later and you get this pos. progress.fanofanand - Friday, February 3, 2017 - link
MicroCenter has long been offering sweetheart mobo + cpu deals, including the 7700K, so I'm not sure what you think you are proving with your comment. Go look at this processor with a mobo at MicroCenter and you tell me what you see.CaedenV - Friday, February 3, 2017 - link
2600 was $230, 2600k was $280I only know because I didn't sleep for a week while I made the decision lol. Ended up with the 2600 non-k because it still boosted to 4.2GHz just fine and that was more than enough horsepower for me. Been using it for 6 years... omg... how is there no clear upgrade yet?
SaolDan - Friday, February 3, 2017 - link
Excellent!Mr Perfect - Friday, February 3, 2017 - link
Wouldn't testing on Windows 10 have changed the results in favor of the i3 a little? It can't use it's Speed Shift v2 in Windows 7.