The Intel Core i3-7350K (60W) Review: Almost a Core i7-2600K
by Ian Cutress on February 3, 2017 8:00 AM ESTLegacy and Synthetic Tests
At AnandTech, I’ve taken somewhat of a dim view to pure synthetic tests, as they fail to be relatable. Nonetheless, our benchmark database spans to a time when that is all we had! We take a few of these tests for a pin with the latest hardware.
Cinebench R10
The R10 version of Cinebench is one of our oldest benchmarks, with data going back more than a few generations. The benchmark is similar to that of the newest R15 version, albeit with a simpler render target and a different strategy for multithreading.
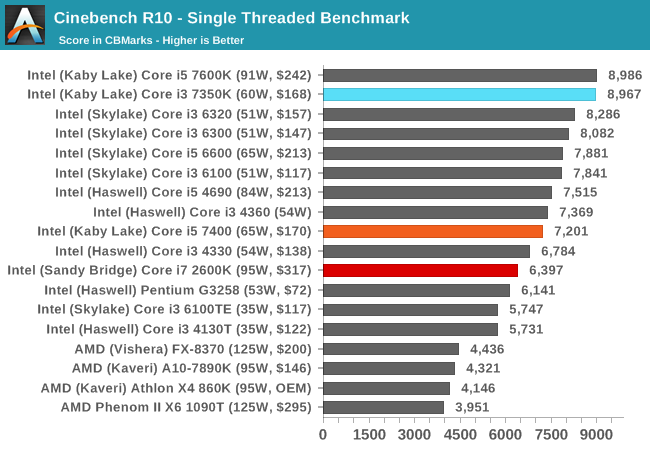
With high frequency in tow, the Core i3-7350K makes its mark.
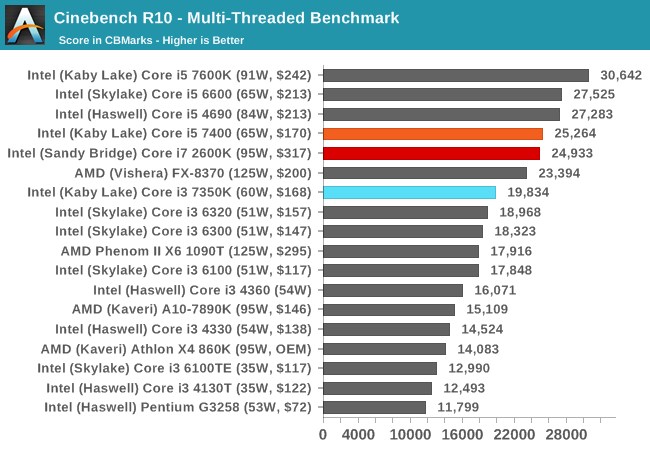
When more threads come to play, the Core i5-7400 and Core i7-2600K battle it out in terms of four cores and IPC vs hyperthreading. The Core i3-7350K sits around ~25% behind.
Cinebench R11.5
CB11.5 has been popular for many years as a performance test, using easy to read and compare numbers that aren’t in the 1000s. We run the benchmark in an automated fashion three times in single-thread and multi-thread mode and take the average of the results.
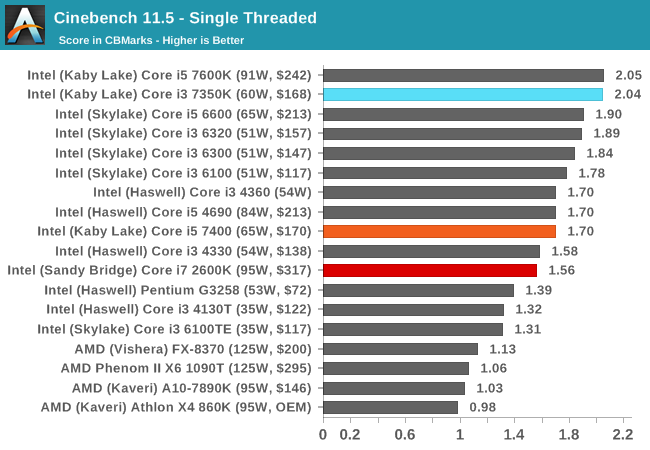
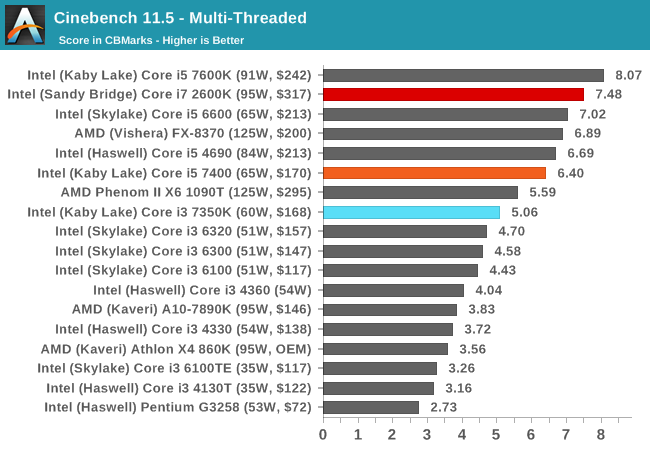
Similar to CB10, the single thread results show that a 4.2 GHz Kaby Lake is nothing to be sniffed at. In the multithreaded test, CB11.5 is more able to leverage the hyperthreads, showing that a Core i7-2600K will run rings around the low end Kaby i5, but is bested by the higher frequency Kaby i5-K. The Core i3 still has that dual core deficit.
7-zip
As an open source compression/decompression tool, 7-zip is easy to test and features a built-in benchmark to measure performance. As a utility, similar to WinRAR, high thread counts, frequency and UPC typically win the day here.
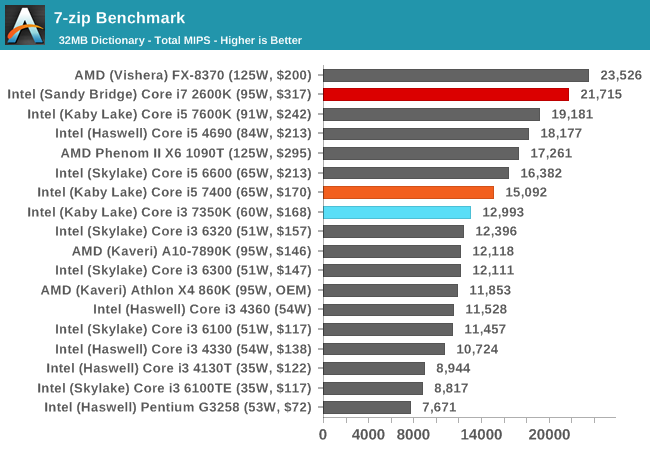
The difference between the i3-7350K and the i5-7400 shows that 7-zip prefers cores over threads, but the Core i7-2600K results show it can use both to good effect, even on older microarchitectures, scoring almost double the i3-7350K.
POV-Ray
Ray-tracing is a typical multithreaded test, with each ray being a potential thread in its own right ensuring that a workload can scale in complexity easily. This lends itself to cores, frequency and IPC: the more, the better.
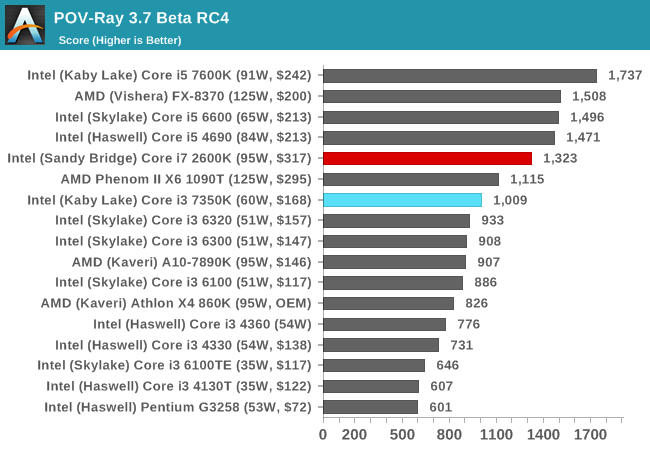
POV-Ray is a benchmark that is usually touted as liking high IPC, high frequency and more threads. The i7-2600K, despite having double the resources of the Core i3-7350K, is only 30% ahead.
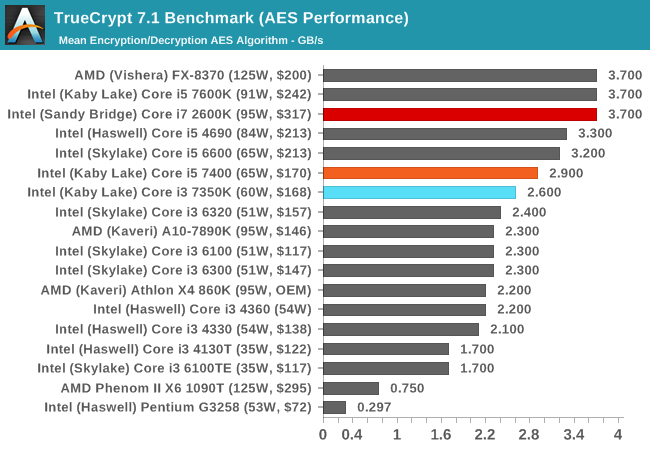
AES via TrueCrypt
Despite TrueCrypt no longer being maintained, the final version incorporates a good test to measure different encryption methodologies as well as encryption combinations. When TrueCrypt was in full swing, the introduction of AES accelerated hardware dialed the performance up a notch, however most of the processors (save the Pentiums/Celerons) now support this and get good speed. The built-in TrueCrypt test does a mass encryption on in-memory data, giving results in GB/s.


186 Comments
View All Comments
JordanV - Tuesday, February 14, 2017 - link
I think the sales argument for the big Intel chips as video encoders has been for x264 where the faster NVENC, VCE, and QuickSync technologies offer lower quality at a given bitrate for higher quality x264 settings. For most people, the hardware encoders are enough but for many others, the quality is not sufficient.The quality difference between hardware and software HEVC is smaller with higher quality software h265 encodes beating the quality of your Pascal x265 encodes but with a big performance penalty. It's not worth it for most people, but if you have limited bitrate/storage and want the best quality, it might be.
HerrKaLeun - Friday, February 3, 2017 - link
Thanks for the great review, Ian.Considering one needs an expensive Z-board to OC, for most people buying an i5 makes more sense.
I don't understand why so many people complain about Intel allegedly not making enough progress. Now you get a dual-core that comes close (or even exceeds in single threaded benches) to the former flagship quadcore. If you want to have a CPU that vastly exceeds the "old" quadcore, Intel also has newer quadcores. It is not like the i3 is the end of the lineup.... For the $317 that the 2600k used to cost you can get a KabyLake non-K i7, which sure vastly exceeds in performance (and much lower TDP). I assume someone who could afford an over $300 CPU 6 years ago can afford $300 now and upgrading to an i3 may not be what that person would do anyway. the trend goes to more cores.... most people here complain about Intel not offering mainstream hexa and octa cores... not sure why the same people allegedly are so eager to get dual-cores.
zodiacfml - Friday, February 3, 2017 - link
Dual core is too weak for me. Web browsing can use more cores.Hulk - Friday, February 3, 2017 - link
Sorry to be dense.What does 2+2, 4+2, 4+3/e mean?
babysam - Saturday, February 4, 2017 - link
The first number refers to the number of CPU cores. Te second number refers to the IGP configuration (the number of shaders, which may be a little bit different across generations, e.g. Haswell GT3 has 40 shaders, while Broadwell/Skylake GT3 have 48 shaders).The extra e means there is an extra eDRAM cache (Crystalwell) on the CPU package.
Hulk - Saturday, February 4, 2017 - link
Thanks.AndrewJacksonZA - Saturday, February 4, 2017 - link
Thank you babysam.babysam - Saturday, February 4, 2017 - link
Thank you for you article (especially when many of us are waiting on the information of new CPU of both AMD and Intel). It is always good to have something to play (overclocked) with, but this is a little bit expensive.When I read the analysis of the first page, I see the lack of information on the CPU die size and transistor count disclosed by Intel recently. Also, I feel strange that the effect of the change of the 32nm to 22nm (from Haswell to Broadwell) have such a large difference on the 2C+GT2(which Intel claims there is a 37% reduction of the die, which can be seen in the table) and the 4C+GT3(which the difference are much smaller) CPU die. I feel even stranger when I see the Skylake 4C+GT3e die is a bit smaller than the Broadwell 4c+GT3e die. So I am quite curious on the sources of the die estimate.
P.S. I found the origin of the 234mm^2 of the Skylake die size estimate.
https://techreport.com/forums/viewtopic.php?t=1177...
which based on the images of the following
http://www.anandtech.com/show/10281/intel-adds-cry...
It seems that the die described is the Skylake-H(which is a 4C+GT4e configuration). This makes the 241.5mm^2 estimate of the Broadwell 4C+GT3e a little bit unrealistic (Skylake GT4e have 72 shaders, while Broadwell GT3e have 48 only)
babysam - Saturday, February 4, 2017 - link
Just find the die size of the Broadwell-H (4C+3e) in this documenthttp://www.intel.com/content/www/us/en/embedded/pr...
According to the document, the die size of Broadwell-H (4C+GT3e) should be 13.7mmx12.3mm = 168.51mm^2
(Many thanks for the hints: https://forums.anandtech.com/threads/broadwell-cor... , which the got the answer two years ago.)
WoodyBL - Saturday, February 4, 2017 - link
Am I the only one noticing that the i5-4690 was beating the i5-7600k in a lot of benchmarks? I'm having a hard time processing how that was even possible...