GEEKOM AS 6 (ASUS PN53) Review: Ryzen 9 6900HX Packs Punches in a Petite Package
by Ganesh T S on July 31, 2023 8:00 AM ESTOur 2022 Q4 update to the test suite for Windows 11-based systems carries over some of the standard benchmarks we have been using over the last several years. While UL's PCMark makes the list, we have opted to temporarily suspend reporting of BAPCo's SYSmark scores (pending fixture of the energy consumption aspect). Instead, BAPCO's CrossMark multi-platform benchmarking tool has been added to the set along with UL's Procyon suite. While CrossMark employs idle time compression and processes all workloads in an opaque manner, UL's Procyon processes real-world workloads with user interactions (like BAPCo's SYSmark). We have augmented the UL Procyon suite benchmark with our own custom energy measurement setup.
UL PCMark 10
UL's PCMark 10 evaluates computing systems for various usage scenarios (generic / essential tasks such as web browsing and starting up applications, productivity tasks such as editing spreadsheets and documents, gaming, and digital content creation). We benchmarked select PCs with the PCMark 10 Extended profile and recorded the scores for various scenarios. These scores are heavily influenced by the CPU and GPU in the system, though the RAM and storage device also play a part. The power plan was set to Balanced for all the PCs while processing the PCMark 10 benchmark. The scores for each contributing component / use-case environment are also graphed below.
| UL PCMark 10 - Performance Scores | |||
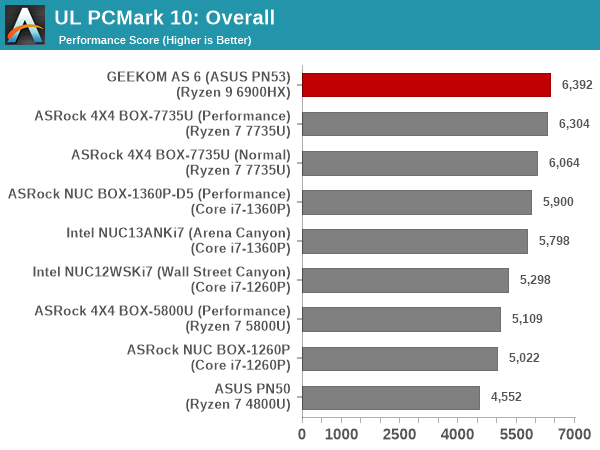
The systems being compared against each other are all configured in a slightly different manner. The Rembrandt SKUs are all 8C/16T configurations with the Ryzen 9 6900HX enjoying a slight clock speed advantage over the Ryzen 7 7735U in the ASRock 4X4 BOX-7735U. The 'Performance' setting for the latter sets the target TDP around 42W, while we will see in a later section that the GEEKOM AS 6 is set for a 35W target TDP. The Arena Canyon NUC and the ASRock NUC BOX-1360P/D5, on the other hand, employ a hybrid processor with a 40W target TDP.
The Raptor Lake-based systems with the 40W TDP configuration enjoy a significant edge in the 'Essentials' segment. However, across all of Productivity, Gaming, and Digital Content Creation, the Rembrandt processors outclass the Raptor Lake ones. Eight high-performance cores seem to be better suited for these workloads compared to a 4P / 8E configuration, and the RDNA2 iGPU with 12 CUs also enjoys a bit of an edge over the Intel Iris Xe Graphics with 96EUs.
UL Procyon v2.1.544
PCMark 10 utilizes open-source software such as Libre Office and GIMP to evaluate system performance. However, many of their professional benchmark customers have been requesting evaluation with commonly-used commercial software such as Microsoft Office and Adobe applications. In order to serve their needs, UL introduced the Procyon benchmark in late 2020. There are five benchmark categories currently - Office Productivity, AI Inference, Battery Life, Photo Editing, and Video Editing. AI Inference benchmarks are available only for Android devices, while the battery life benchmark is applicable to Windows devices such as notebooks and tablets. We presents results from our processing of the other three benchmarks.
| UL Procyon - Office Productivity Scores | |||
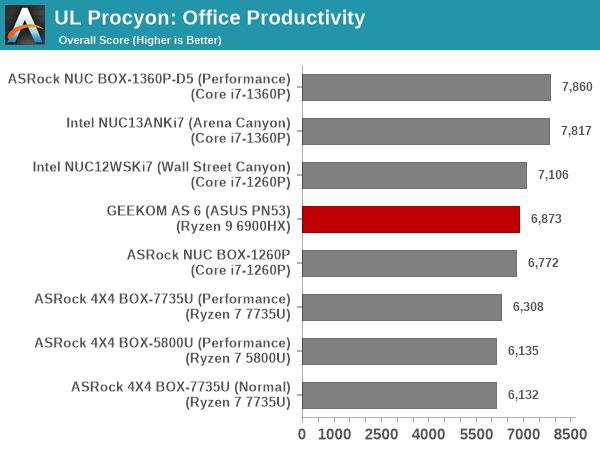
The results from the UL Procyon Office Productivity Suite are similar to what was seen for the Essentials suite in PCMark. The Raptor Lake-P systems with a 40W TDP outperform the Rembrandt systems across the board.
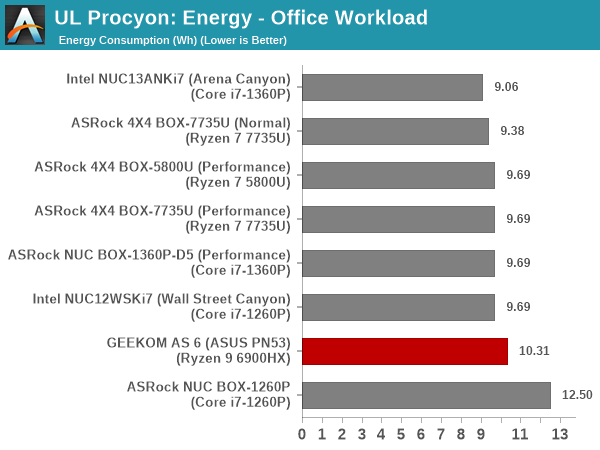
From an energy consumption viewpoint, the Intel NUC (Arena Canyon) seems to be the most optimized of the lot, getting the job done fast enough to be second in the performance charts without consuming too much power in the process. The GEEKOM AS 6 doesn't seem to be energy efficient for this workload.
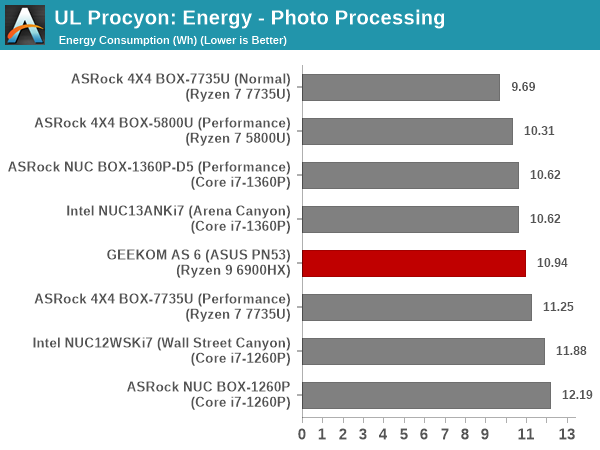
Moving on to the evaluation of Adobe Photoshop and Adobe Lightroom, we find the Raptor Lake-P systems having the edge over the Rembrandt ones.
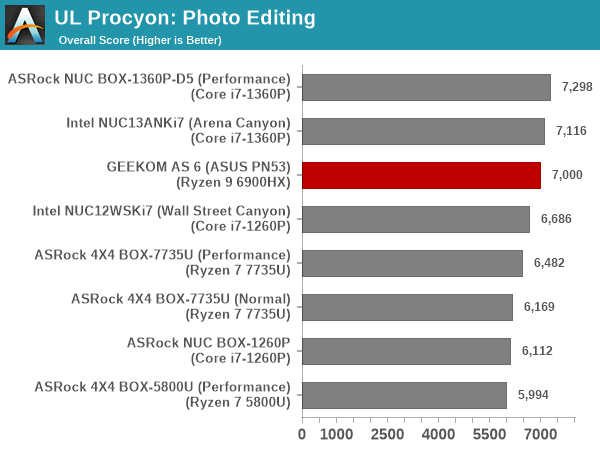
While the ASRock Industrial 4X4 BOX-7735U in a 28W configuration gets the job done with minimum energy consumption, the GEEKOM AS 6 manages to make it to the middle of the pack in this aspect.
UL Procyon evaluates performance for video editing using Adobe Premier Pro. While rendering and playback can make use of the GPU, the main encoding task is still left to the CPU. Here, more high-performance cores with a bigger power budget can potentially help. The ASRock Industrial NUC BOX-1360P/D5 completes the job in the least time, but is beat on energy efficiency only by the 28W Rembrandt configuration (which is in the middle of the pack with respect to time taken).
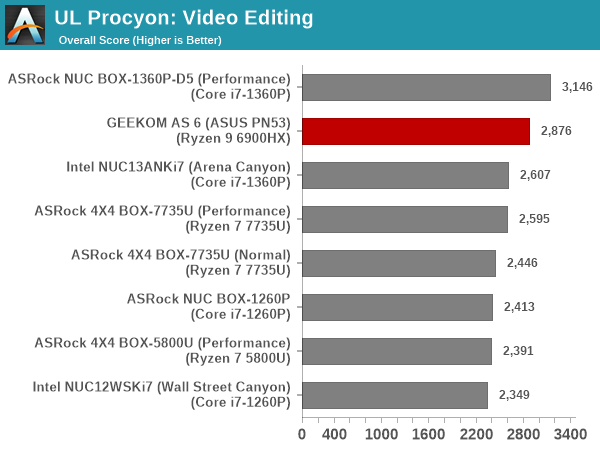
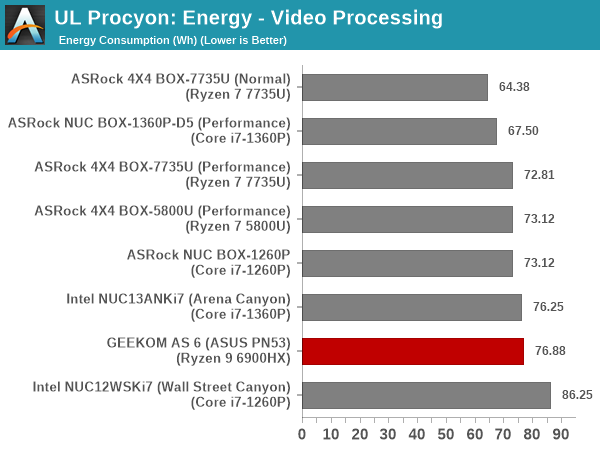
The GEEKOM AS 6 gets the job done faster than the Arena Canyon NUC and all other contenders (except the NUC BOX-1360P/D5), but energy efficiency is not its forte. Only the Wall Street Canyon NUC fares worse in that aspect.
BAPCo CrossMark 1.0.1.86
BAPCo's CrossMark aims to simplify benchmark processing while still delivering scores that roughly tally with SYSmark. The main advantage is the cross-platform nature of the tool - allowing it to be run on smartphones and tablets as well.
| BAPCo CrossMark 1.0.1.86 - Sub-Category Scores | |||
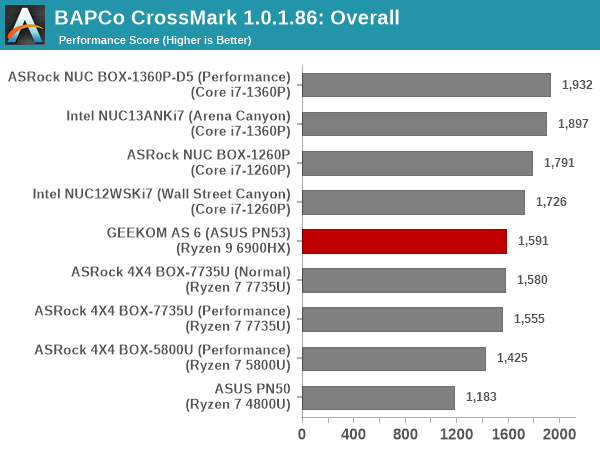
The relative performance seen in the UL Procyon office workloads translate to BAPCo's CrossMark also, but the gulf is a bit wider here. Idle time compression seems to favor the Raptor Lake-P systems more, and the GEEKOM AS 6 is placed in the middle of the pack overall. Since CrossMark attempts to consolidate different workloads together without idle time intervals and play it back in a non-real-time environment, it is not entirely representative of real-world performance like PCMark 10 and UL Procyon. Therefore, tasks requiring frequent user interaction are better represented by those other benchmarks.


14 Comments
View All Comments
haplo602 - Wednesday, August 2, 2023 - link
So you review an Asus rebrand but ignore all the upstart minipc manufacturers that were on the market months before this one ? Interesting choice ...nicolaim - Wednesday, August 2, 2023 - link
Me again. 2023, yet only two USB-C ports. WTF!?eriri-el - Monday, August 7, 2023 - link
"The activation of the GPU shaders for rendering in the GPU-HQ case results in relatively higher energy numbers for all the systems."Any citation for this? AFAIK GPU-HQ is just a profile to activate higher quality scaling.
Here is my citation:
https://github.com/mpv-player/mpv/blob/35a6b26b780...
If you tell me that the scalers are using shaders (which i'm not really sure whether are they doing so or not) then the non GPU-HQ preset scalers are shaders too and therefore GPU shaders are activated regardless you use GPU-HQ or not. Is your benchmark invalid since its based on a false premise?
ganeshts - Sunday, August 13, 2023 - link
There is no 'false premise' to talk of here - in fact, the attempt is to provide analysis based on the obtained results.The software used, and the settings are detailed in the section. Anybody can feel free to reproduce the results.
As for the statement 'activation of GPU shaders for GPU-HQ case' - the default case playback uses bilinear algorithm for chroma scaling (as an example), and that should be handled by fixed function hardware in most GPUs [ https://github.com/mpv-player/mpv/issues/10306#iss... ]. Of course, I have not looked in detail into the mpv code base, but based on the energy numbers for GPU-HQ vs. default (for the GEEKOM AS6 - 9.69 Wh vs. 8.12 Wh), and GPU D3D Usage for the two cases for different files, it looks like some additional work is being done on the GPU and my educated guess is that the GPU shader work is far more for GPU-HQ compared to the default case.