Intel Motherboards: Can a Diamond beat a Royal Flush?
by Gary Key on September 23, 2005 12:05 AM EST- Posted in
- Motherboards
Disk Controller Performance
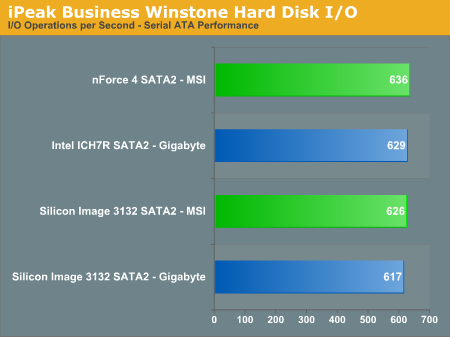
With the variety storage controllers available on these two boards, we needed a means of comparing performance on the wide selection of controllers. The logical choice was Anand's storage benchmark first described in Q2 2004 Desktop Hard Drive Comparison: WD Raptor vs. the World. To refresh your memory, the iPeak test was designed to measure "pure" hard disk performance, and in this case, we kept the hard drive as consistent as possible while varying the hard drive controller. The idea is to measure the performance of a hard drive controller with a consistent hard drive.
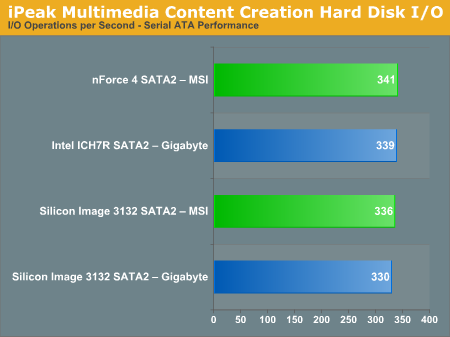
We played back Anand's raw files that recorded I/O operations when running a real world benchmark - the entire Winstone 2004 suite. Intel's iPEAK utility was then used to play back the trace file of all IO operations that took place during a single run of Business Winstone 2004 and MCC Winstone 2004. To try to isolate performance difference to the controllers that we were testing, we used the Maxtor MaXLine III 7L300S0 300GB 7200 RPM SATA drive in all tests. The drive was formatted before each test run and a composite average of 5 tests on each controller interface was tabulated in order to ensure consistency in the benchmark.
iPeak gives a mean service time in milliseconds; in other words, the average time that each drive took to fulfill each IO operation. In order to make the data more understandable, we report the scores as an average number of IO operations per second so that higher scores translate into better performance. This number is meaningless as far as hard disk performance is concerned as it is just the number of IO operations completed in a second. However, the scores are useful for comparing "pure" performance of the storage controllers in this case.
With the variety storage controllers available on these two boards, we needed a means of comparing performance on the wide selection of controllers. The logical choice was Anand's storage benchmark first described in Q2 2004 Desktop Hard Drive Comparison: WD Raptor vs. the World. To refresh your memory, the iPeak test was designed to measure "pure" hard disk performance, and in this case, we kept the hard drive as consistent as possible while varying the hard drive controller. The idea is to measure the performance of a hard drive controller with a consistent hard drive.
We played back Anand's raw files that recorded I/O operations when running a real world benchmark - the entire Winstone 2004 suite. Intel's iPEAK utility was then used to play back the trace file of all IO operations that took place during a single run of Business Winstone 2004 and MCC Winstone 2004. To try to isolate performance difference to the controllers that we were testing, we used the Maxtor MaXLine III 7L300S0 300GB 7200 RPM SATA drive in all tests. The drive was formatted before each test run and a composite average of 5 tests on each controller interface was tabulated in order to ensure consistency in the benchmark.
iPeak gives a mean service time in milliseconds; in other words, the average time that each drive took to fulfill each IO operation. In order to make the data more understandable, we report the scores as an average number of IO operations per second so that higher scores translate into better performance. This number is meaningless as far as hard disk performance is concerned as it is just the number of IO operations completed in a second. However, the scores are useful for comparing "pure" performance of the storage controllers in this case.


19 Comments
View All Comments
smn198 - Friday, September 23, 2005 - link
Welcome Gary. Look forward to seeing more from you.Gary Key - Friday, September 23, 2005 - link
smn198,Thank you. I really enjoyed doing this article, working with Wes, and having the opportunity to share my experiences with the great members and visitors here at AnandTech. I certainly hope you will be seeing more from me. ;-)
Sincerely,
Gary Key
Evan Lieb - Friday, September 23, 2005 - link
Welcome Gary, and have fun!Ecmaster76 - Friday, September 23, 2005 - link
Looks like it went up early.Good read though. At first I was like "Holy $#!+" when I saw the gaming benchmarks, but then they mentioned about the Gigabyte BIOS being effed up.
cryptonomicon - Thursday, September 22, 2005 - link
DRAM Voltage Auto, 1.80V to 2.3V in 0.1V incrementsuh.. but isnt ram like 2.5-2.8v?
Pete84 - Friday, September 23, 2005 - link
DDR2 runs at much lower vdimm than DDR.cryptonomicon - Friday, September 23, 2005 - link
ah yes of course..so much for active cooling then
BlvdKing - Thursday, September 22, 2005 - link
I can't believe the Nforce 4 for AMD supports dual core but the Intel edition only has limited support and no support for the 820.coomar - Wednesday, September 21, 2005 - link
no a diamond can't beat a royal flush