The AMD Radeon R9 Fury Review, Feat. Sapphire & ASUS
by Ryan Smith on July 10, 2015 9:00 AM ESTCompute
Shifting gears, we have our look at compute performance. As compute performance will be more significantly impacted by the reduction in CUs than most other tests, we’re expecting the performance hit for the R9 Fury relative to the R9 Fury X to be more significant here than under our gaming tests.
Starting us off for our look at compute is LuxMark3.0, the latest version of the official benchmark of LuxRender 2.0. LuxRender’s GPU-accelerated rendering mode is an OpenCL based ray tracer that forms a part of the larger LuxRender suite. Ray tracing has become a stronghold for GPUs in recent years as ray tracing maps well to GPU pipelines, allowing artists to render scenes much more quickly than with CPUs alone.
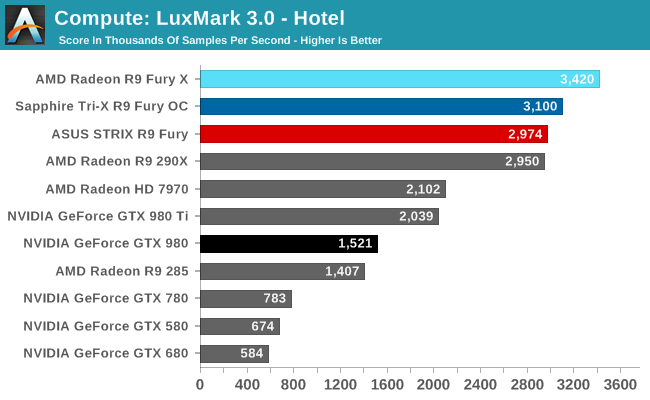
For LuxMark with the R9 Fury X already holding the top spot, the R9 Fury cards easily take the next two spots. One interesting artifact of this is that the R9 Fury’s advantage over the GTX 980 is actually greater than the R9 Fury X’s over the GTX 980 Ti’s, both on an absolute and relative basis. This despite the fact that the R9 Fury is some 13% slower than its fully enabled sibling.
For our second set of compute benchmarks we have CompuBench 1.5, the successor to CLBenchmark. CompuBench offers a wide array of different practical compute workloads, and we’ve decided to focus on face detection, optical flow modeling, and particle simulations.
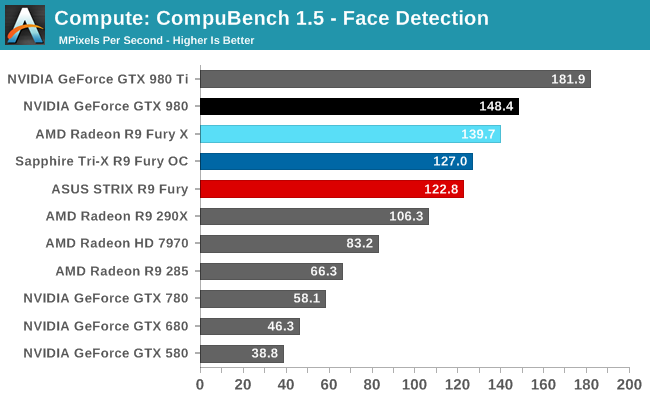
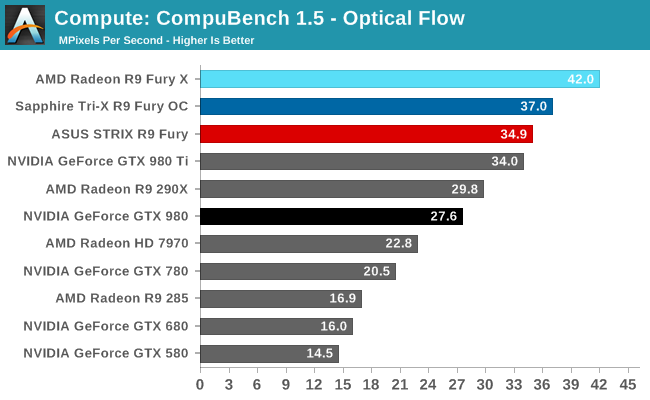
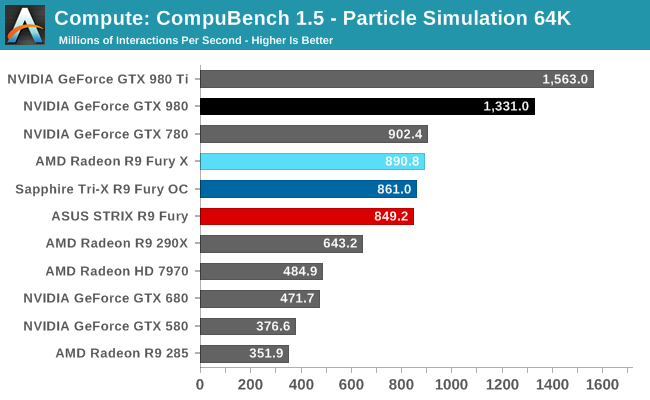
Not unlike LuxMark, tests where the R9 Fury X did well have the R9 Fury doing well too, particularly the optical flow sub-benchmark. The drop-off in that benchmark and face detection is about what we’d expect for losing 1/8th of Fiji’s CUs. On the other hand the particle simulation benchmark is hardly fazed beyond the clockspeed drop, indicating that the bottleneck lies elsewhere.
Our 3rd compute benchmark is Sony Vegas Pro 13, an OpenGL and OpenCL video editing and authoring package. Vegas can use GPUs in a few different ways, the primary uses being to accelerate the video effects and compositing process itself, and in the video encoding step. With video encoding being increasingly offloaded to dedicated DSPs these days we’re focusing on the editing and compositing process, rendering to a low CPU overhead format (XDCAM EX). This specific test comes from Sony, and measures how long it takes to render a video.
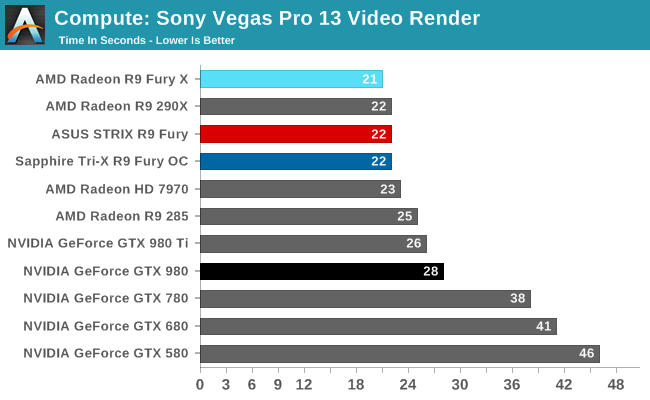
At this point Vegas is becoming increasingly CPU-bound and will be due for replacement. The R9 Fury comes in one second behind the chart-topping R9 Fury X, at 22 seconds.
Moving on, our 4th compute benchmark is FAHBench, the official Folding @ Home benchmark. Folding @ Home is the popular Stanford-backed research and distributed computing initiative that has work distributed to millions of volunteer computers over the internet, each of which is responsible for a tiny slice of a protein folding simulation. FAHBench can test both single precision and double precision floating point performance, with single precision being the most useful metric for most consumer cards due to their low double precision performance. Each precision has two modes, explicit and implicit, the difference being whether water atoms are included in the simulation, which adds quite a bit of work and overhead. This is another OpenCL test, utilizing the OpenCL path for FAHCore 17.
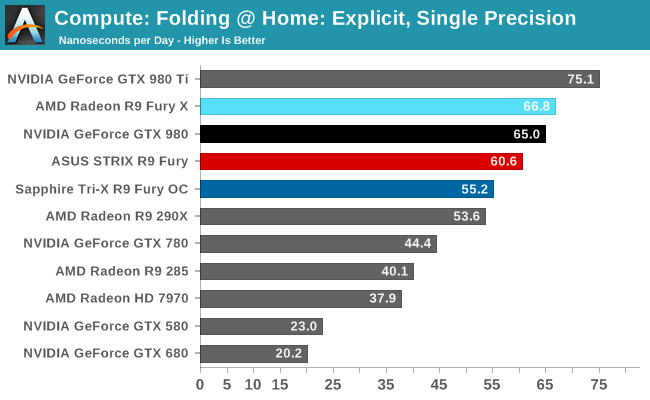
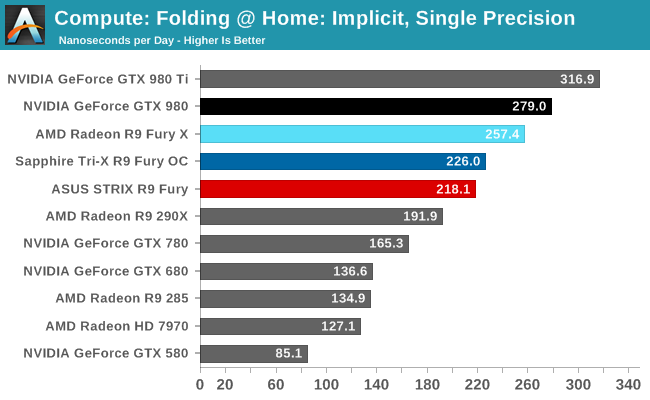
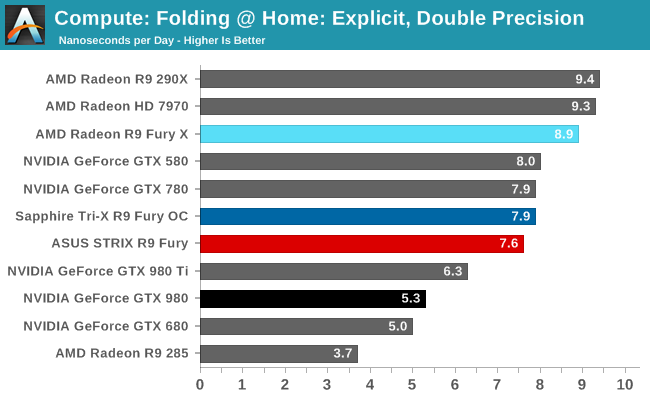
Overall while the R9 Fury doesn’t have to aim quite as high given its weaker GTX 980 competition, FAHBench still stresses the Radeon cards. Under single precision tests the GTX 980 pulls ahead, only surpassed under double precision thanks to NVIDIA’s weaker FP64 performance.
Wrapping things up, our final compute benchmark is an in-house project developed by our very own Dr. Ian Cutress. SystemCompute is our first C++ AMP benchmark, utilizing Microsoft’s simple C++ extensions to allow the easy use of GPU computing in C++ programs. SystemCompute in turn is a collection of benchmarks for several different fundamental compute algorithms, with the final score represented in points. DirectCompute is the compute backend for C++ AMP on Windows, so this forms our other DirectCompute test.
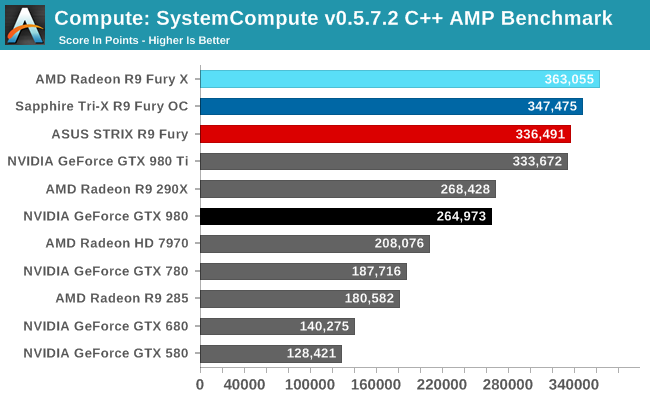
As with our other tests the R9 Fury loses some performance on our C++ AMP benchmark relative to the R9 Fury X, but only around 8%. As a result it’s competitive with the GTX 980 Ti here, blowing well past the GTX 980.


288 Comments
View All Comments
akamateau - Tuesday, July 14, 2015 - link
Radeon 290x is 33% faster than 980 Ti with DX12 and Mantle. It is equal to Titan X.http://wccftech.com/amd-r9-290x-fast-titan-dx12-en...
Sefem - Wednesday, July 15, 2015 - link
You should stop reading wccftech.com this site is full of sh1t! you made also an error because they are comparing 290x to 980 and not the Ti!Asd :D I'm still laughing... those moron cited PCper's numbers as fps, they probably made the assumption since are 2 digit numbers but that's because PCper show numbers in million!!! look at that http://www.pcper.com/files/imagecache/article_max_...
wccftech.com also compare the the 290x on Mantle with the 980 on DX12, probably for an apple to apple comparison ;), the fun continue if you read this Futurmark's not on this particular benchmark, that essentially says something pretty obvious, number of draw calls don't reflect actual performance and thus shouldn't be used to compare GPU's
http://a.disquscdn.com/uploads/mediaembed/images/1...
Finally I think there's something wrong with PC world's results since NVIDIA should deliver more draw calls than AMD on DX11.
FlushedBubblyJock - Wednesday, July 15, 2015 - link
They told us Fury X was 20% and more faster, they lied then, too.Now amd fanboys need DX12 as a lying tool.
Failure requires lying, for fanboys.
Drumsticks - Friday, July 10, 2015 - link
Man auto correct plus an early morning post is hard. I meant "do you expect more optimized drivers to cause the Fury to leap further ahead of the 980, or the Fury X to catch up to the 980 Ti" haha. My bad.My first initial impression on that assessment would be yes, but I'm not an expert so I was wondering how many people would like to weigh in.
Samus - Friday, July 10, 2015 - link
Fuji has a lot more room for driver improvement and optimization than maxwell, which is quite well optimized by now. I'd expect the fury x to tie the 980ti in the near future, especially in dx12 games. But nvidia will probably have their new architecture ready by then.FlushedBubblyJock - Wednesday, July 15, 2015 - link
So, Nvidia is faster, and has been for many months, and still is faster, but a year or two into the future when amd finally has dxq12 drivers and there are actually one or two Dx12 games,why then, amd will have a card....
MY GOD HOW PATHETIC. I mean it sounded so good, you massaging their incompetence and utter loss.
evolucion8 - Friday, July 17, 2015 - link
Your continuous AMD bashing is more pathetic. Check the performance numbers of the GTX 680 when it was launched and check where it stands now? Do the same thing with the GTX 780 and then with the GTX 970, then talk.CiccioB - Monday, July 13, 2015 - link
That is another confirmation that AMD GCN doesn't scale well. That problem was already seen with Hawaii, but also Tahiti showed it's inefficiency with respect to smaller GPUs like Pitcairn.Nvidia GPUs scales almost linearly with respect to the resources integrated into the chip.
This has been a problem for AMD up to now, but it would be worse with new PP, as if no changes to solve this are introduced, nvidia could enlarge its gap with respect to AMD performances when they both can more than double the number of resources on the same die area.
Sdriver - Wednesday, July 15, 2015 - link
This resources reduction just means that AMD performance bottleneck is somewhere else in card. We have to see that this kind of reduction is not made to purposely slow down a card but to reduce costs or to utilize chips which didn't pass all tests to become a X model. AMD is know to do that since their weird but very functional 3 cores Phenons. Also this means if they can work better on the real bottleneck, they will be able to make a stronger card with much less resources, who remembers the HD 4770?...akamateau - Tuesday, July 14, 2015 - link
@ Ryan SmithThis review is actually a BIG LIE.
ANAND is hiding the DX12 results that show 390x outperforming GTX 980Ti by 33%+, Fury outperforming 980ti by almost 50% and Titan X by almost 20%.
Figures do not lie. BUT LIARS FIGURE.
Draw calls are the best metric we have right now to compare AMD Radeon to nVidia ON A LEVEL PLAYING FIELD.
You can not render and object before you draw it!
I dare you to run the 3dMark API Overhead Feature Tests on Fury show how Mantle and DX12 turns nVidia siliocn into RUBBISH.
Radeon 290x CRUSHES 980Ti by 33% and is just a bit better than Titan X.
www dot eteknix.com/amd-r9-290x-goes-head-to-head-with-titan-x-with-dx12/
"AMD R9 290X As Fast As Titan X in DX12 Enabled 3DMark – 33% Faster Than GTX 980"
www dot wccftech dot com/amd-r9-290x-fast-titan-dx12-enabled-3dmark-33-faster-gtx-980/