The Intel Xeon W Review: W-2195, W-2155, W-2123, W-2104 and W-2102 Tested
by Ian Cutress & Joe Shields on July 30, 2018 1:00 PM EST- Posted in
- CPUs
- Intel
- Xeon
- Workstation
- ECC
- Skylake-SP
- Skylake-X
- Xeon-W
- Xeon Scalable
Benchmarking Performance: CPU Rendering Tests
Rendering tests are a long-time favorite of reviewers and benchmarkers, as the code used by rendering packages is usually highly optimized to squeeze every little bit of performance out. Sometimes rendering programs end up being heavily memory dependent as well - when you have that many threads flying about with a ton of data, having low latency memory can be key to everything. Here we take a few of the usual rendering packages under Windows 10, as well as a few new interesting benchmarks.
All of our benchmark results can also be found in our benchmark engine, Bench.
Corona 1.3: link
Corona is a standalone package designed to assist software like 3ds Max and Maya with photorealism via ray tracing. It's simple - shoot rays, get pixels. OK, it's more complicated than that, but the benchmark renders a fixed scene six times and offers results in terms of time and rays per second. The official benchmark tables list user submitted results in terms of time, however I feel rays per second is a better metric (in general, scores where higher is better seem to be easier to explain anyway). Corona likes to pile on the threads, so the results end up being very staggered based on thread count.
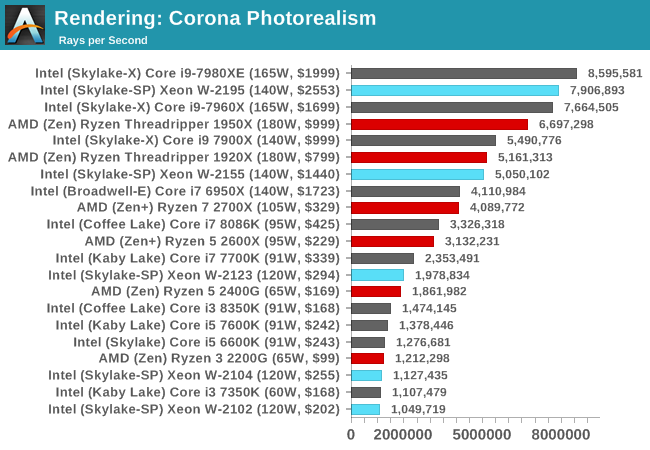
Corona is very multi-threaded, so we expect most of the chips to push their legs on this one. The difference between the W-2195 and the Core i9-7980XE is much more as we expect for a fully MT test, with the W-2155 trading blows with the TR 1920X and the lower quad-core SKUs bringing up the rear.
Blender 2.78: link
For a render that has been around for what seems like ages, Blender is still a highly popular tool. We managed to wrap up a standard workload into the February 5 nightly build of Blender and measure the time it takes to render the first frame of the scene. Being one of the bigger open source tools out there, it means both AMD and Intel work actively to help improve the codebase, for better or for worse on their own/each other's microarchitecture.
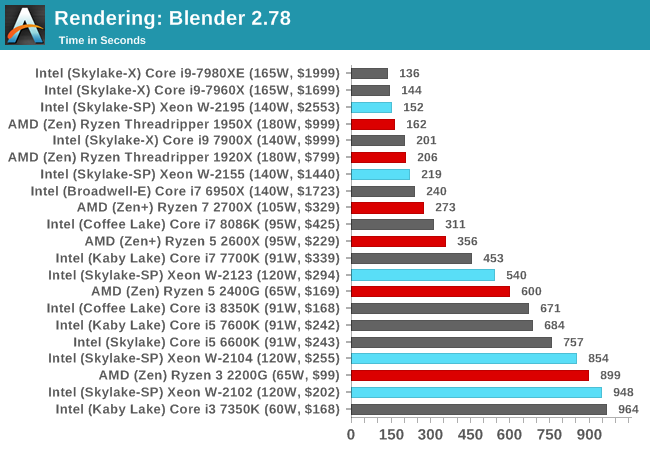
Blender is a very threaded test, but not completely, as we can see with the W-2195 still trailing even the Core i9-7960X. The W-2104 is pushing against the Core i5-6600K, despite the lower frequency, due to the quad-channel memory in play.
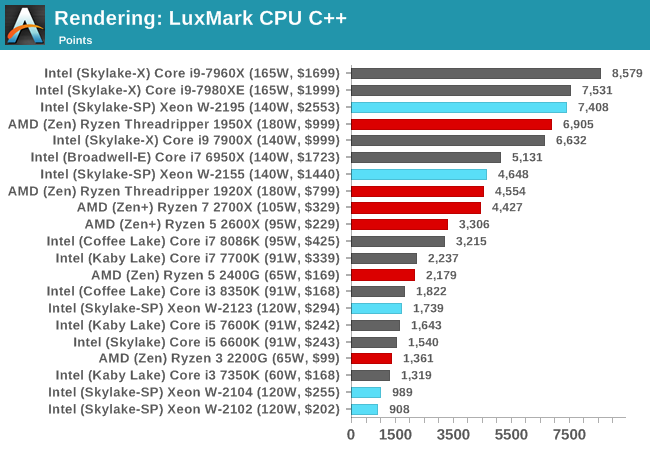
LuxMark v3.1: Link
As a synthetic, LuxMark might come across as somewhat arbitrary as a renderer, given that it's mainly used to test GPUs, but it does offer both an OpenCL and a standard C++ mode. In this instance, aside from seeing the comparison in each coding mode for cores and IPC, we also get to see the difference in performance moving from a C++ based code-stack to an OpenCL one with a CPU as the main host.
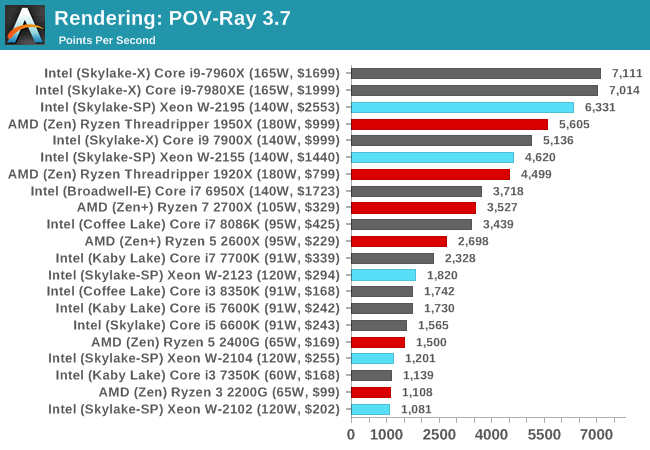
POV-Ray 3.7.1b4
Another regular benchmark in most suites, POV-Ray is another ray-tracer but has been around for many years. It just so happens that during the run up to AMD's Ryzen launch, the code base started to get active again with developers making changes to the code and pushing out updates. Our version and benchmarking started just before that was happening, but given time we will see where the POV-Ray code ends up and adjust in due course.
Cinebench R15: link
The latest version of CineBench has also become one of those 'used everywhere' benchmarks, particularly as an indicator of single thread performance. High IPC and high frequency gives performance in ST, whereas having good scaling and many cores is where the MT test wins out.
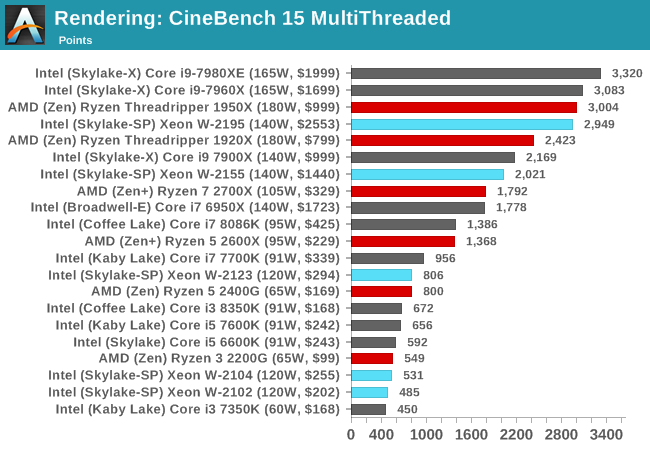
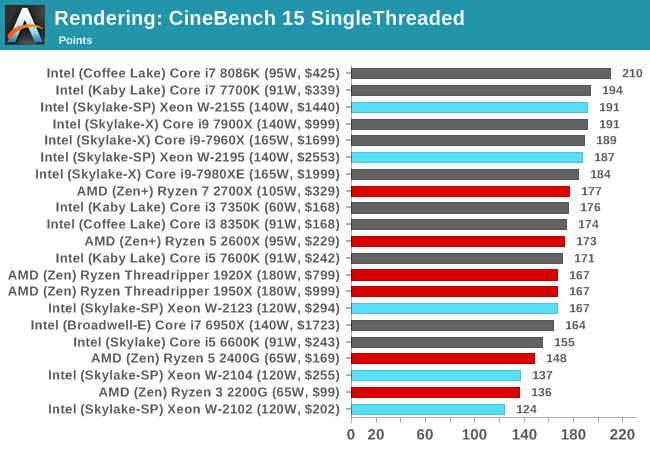
Cinebench is a 'classic' benchmark, despite being four generations behind the Cinema4D software at this point. The W-2195 goes toe-to-toe in the multithreaded test against the TR 1950X, but easily wins against it in the single threaded test. The W-2195 also beats the i9-7980XE in ST, but loses in MT.


74 Comments
View All Comments
mode_13h - Monday, July 30, 2018 - link
Just the fact that you need to map your VMs to stay on the same physical core, for best performance (i.e. so that the memory is local to it). If you do that, TR is actually a great VM solution.Death666Angel - Monday, July 30, 2018 - link
That doesn't sound so complicated as to be a "situation" for someone dealing with VMs. :) Seems like a general setup config thing that you just check off when you do it once.mode_13h - Tuesday, July 31, 2018 - link
Sorry, I meant "same physical die". Actually, best results are from setting affinity at the CCX (i.e. 4-core) granularity.SanX - Tuesday, July 31, 2018 - link
The day ARM announced it developed 8 and 16-core server and supercomputer chips at their usual price around $25 per 5 billion transistors, Intel Xeon prices would plunge 10-50x.Infy2 - Monday, July 30, 2018 - link
It would be helpful on those charts if there was an indicator how many cores/threads in CPU has.Ian Cutress - Monday, July 30, 2018 - link
We used to have that info in the graphs, however people found it redundant when it was elsewhere, and price/power was requested instead. It's hard to put all the info of every part into every graph!Death666Angel - Monday, July 30, 2018 - link
Can that not be coded as a tooltip/mouse-over text? That would be neat and not add clutter while adding information to those who want it. :)Ian Cutress - Monday, July 30, 2018 - link
Graphs are images generated locally from the data. I'm not au fait with how our back end works, but that's require more than a simple rewriteDeath666Angel - Tuesday, July 31, 2018 - link
Alright. :) Shame though, would be a useful feature for some. Maybe add it to an overhaul list, if such a thing exists. :)lkuzmanov - Tuesday, July 31, 2018 - link
I'm with Infy2 on this one, not sure who protested, but I think something like (10/20) next to the model wouldn't be too distracting or cost too much screen space. I caught myself having to go back to the first page of the article to check the core count of the Xeon parts. That said - great content, you're one of my daily go-to sites.