The ASRock X99E-ITX/ac Review: Up to 36 Threads in Mini-ITX
by Ian Cutress on June 24, 2015 8:00 AM ESTSystem Performance
Power Consumption
Power consumption was tested on the system while in a single MSI GTX 770 Lightning GPU configuration with a wall meter connected to the OCZ 1250W power supply. This power supply is Gold rated, and as I am in the UK on a 230-240 V supply, leads to ~75% efficiency > 50W, and 90%+ efficiency at 250W, suitable for both idle and multi-GPU loading. This method of power reading allows us to compare the power management of the UEFI and the board to supply components with power under load, and includes typical PSU losses due to efficiency. These are the real world values that consumers may expect from a typical system (minus the monitor) using this motherboard.
While this method for power measurement may not be ideal, and you feel these numbers are not representative due to the high wattage power supply being used (we use the same PSU to remain consistent over a series of reviews, and the fact that some boards on our test bed get tested with three or four high powered GPUs), the important point to take away is the relationship between the numbers. These boards are all under the same conditions, and thus the differences between them should be easy to spot.
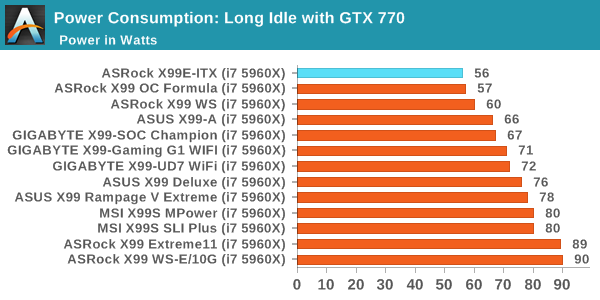
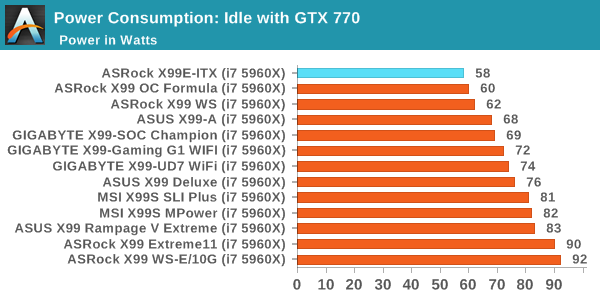
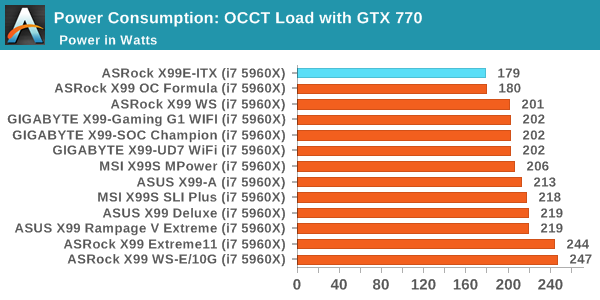
With the small form factor system, one would hope that the power consumption is low due to the lack of other components compared to the larger ATX and EATX motherboards. Thankfully, the X99E-ITX falls in line, almost matching the OC Formula but coming top in each metric. Part of this will be due to only having two modules of DRAM installed.
Windows 7 POST Time
Different motherboards have different POST sequences before an operating system is initialized. A lot of this is dependent on the board itself, and POST boot time is determined by the controllers on board (and the sequence of how those extras are organized). As part of our testing, we look at the POST Boot Time using a stopwatch. This is the time from pressing the ON button on the computer to when Windows 7 starts loading. (We discount Windows loading as it is highly variable given Windows specific features.)
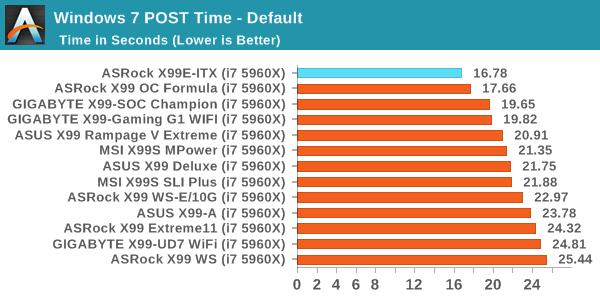
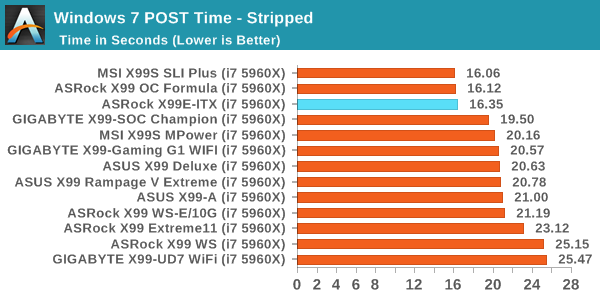
By virtue of having fewer components, one would also assume a quicker POST time. One of the big issues with POST time for X99 is DRAM testing/training at POST, which can take ten seconds and is required to ensure stability. By virtue of having fewer memory channels to be populated, the X99E-ITX gets nearer 15 seconds than the 20 second benchmark we normally have with X99 motherboards.
Rightmark Audio Analyzer 6.2.5
Rightmark:AA indicates how well the sound system is built and isolated from electrical interference (either internally or externally). For this test we connect the Line Out to the Line In using a short six inch 3.5mm to 3.5mm high-quality jack, turn the OS speaker volume to 100%, and run the Rightmark default test suite at 192 kHz, 24-bit. The OS is tuned to 192 kHz/24-bit input and output, and the Line-In volume is adjusted until we have the best RMAA value in the mini-pretest. We look specifically at the Dynamic Range of the audio codec used on board, as well as the Total Harmonic Distortion + Noise.
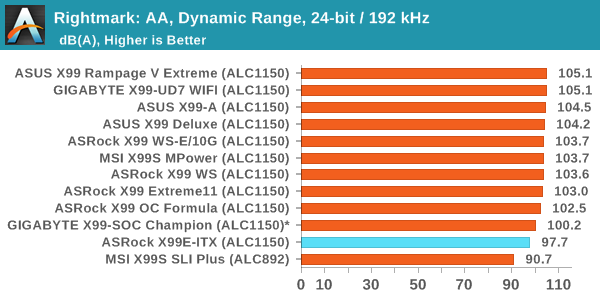
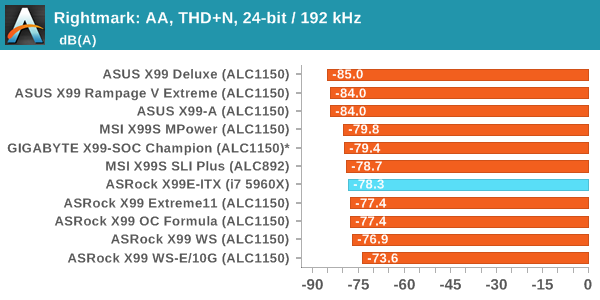
By having a smaller motherboard, ASRock is unable to implement the normal features around their improved ALC1150 audio solution. This technically should give a slightly noisier signal, and as a result the X99E-ITX/ac has a lower dynamic range than the other X99 motherboards with the ALC1150.
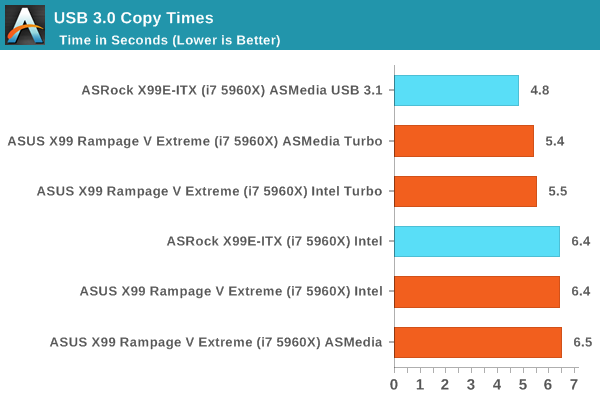
USB Backup
For this benchmark, we transfer a set size of files from the SSD to the USB drive using DiskBench, which monitors the time taken to transfer. The files transferred are a 1.52 GB set of 2867 files across 320 folders – 95% of these files are small typical website files, and the rest (90% of the size) are small 30 second HD videos. In an update to pre-Z87 testing, we also run MaxCPU to load up one of the threads during the test which improves general performance up to 15% by causing all the internal pathways to run at full speed.
Due to the introduction of USB 3.1, as of June 2015 we are adjusting our test to use a dual mSATA USB 3.1 Type-C device which should be capable of saturating both USB 3.0 and USB 3.1 connections. We still use the same data set as before, but now use the new device. Results are shown as seconds taken to complete the data transfer. As this way of testing is still new, we have only a few results so far.
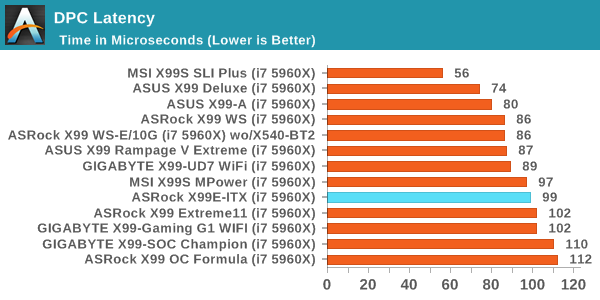
DPC Latency
Deferred Procedure Call latency is a way in which Windows handles interrupt servicing. In order to wait for a processor to acknowledge the request, the system will queue all interrupt requests by priority. Critical interrupts will be handled as soon as possible, whereas lesser priority requests such as audio will be further down the line. If the audio device requires data, it will have to wait until the request is processed before the buffer is filled.
If the device drivers of higher priority components in a system are poorly implemented, this can cause delays in request scheduling and process time. This can lead to an empty audio buffer and characteristic audible pauses, pops and clicks. The DPC latency checker measures how much time is taken processing DPCs from driver invocation. The lower the value will result in better audio transfer at smaller buffer sizes. Results are measured in microseconds.


56 Comments
View All Comments
mobutu - Wednesday, June 24, 2015 - link
"For readers expecting the AMD Fury X review, unfortunately Ryan has been battling a virus this week and despite his best efforts it has taken its toll"lol, this was the same reason given for the missing nvidia 960 review, and then it was next week, then next etc and its like half a year late already ...
1mpetuous - Wednesday, June 24, 2015 - link
If you're too desperate to wait for analysis the raw data is already in Bench.der - Wednesday, June 24, 2015 - link
20th comment.MOAR THREADS MOAR POWER!
bernstein - Wednesday, June 24, 2015 - link
while it might be *cool* to have 18 cores in mITX form, $4500 for such a cpu makes it prohibitively expensive for almost all mITX use-cases, heck even 14 cores at $2750 or 10 at $2000 i mostly just wasting money. these are designed & sold for 2S or 4S configurations!its the E5-16xx v3 cpus that make most sense... so were talking up to 8 cores...
bernstein - Wednesday, June 24, 2015 - link
or a i7-5xx0... but then you loose ECC...MrSpadge - Wednesday, June 24, 2015 - link
I think the 5820K would be best suited for this mainboard, as it relaxes cooling and is going to "suffer" the least from dual channel memory.cyrusfox - Wednesday, June 24, 2015 - link
I don't get it, one of the reasons I would get this platform is for quad channel memory, seems like they could have made this work by using sodimms and doing some inventive layout by allowing half the ram to be attached to the back of the board.DanNeely - Wednesday, June 24, 2015 - link
If they used SoDIMMs an equal number of commenters would be flaming it for being limited to crappy lower performing ram. At present availability might be a problem too. Newegg and Amazon don't appear to have any DDR4 SoDIMMs available; and the only capacity Micron lists as being in production is an 8GB version.yuhong - Wednesday, June 24, 2015 - link
I think there is another server oriented mini ITX X99 board that does that, using DDR4 ECC SO-DIMMs I think. Unfortunately they are more expensive at this point.creed3020 - Monday, June 29, 2015 - link
Look no further than the ASRock RACK EPC612D4I for a mITX board with LGA2011-3 and quad channel memory support.http://www.servethehome.com/asrock-rack-epc612d4i-...