X-Gene 1, Atom C2000 and Xeon E3: Exploring the Scale-Out Server World
by Johan De Gelas on March 9, 2015 2:00 PM ESTMemory Subsystem: Latency
To measure latency, we use the open source TinyMemBench benchmark. The source was compiled for x86 with gcc 4.8.2 and optimization was set to "-O2". The measurement is described well by the manual of TinyMemBench:
Average time is measured for random memory accesses in the buffers of different sizes. The larger the buffer, the more significant the relative contributions of TLB, L1/L2 cache misses, and DRAM accesses become. All the numbers represent extra time, which needs to be added to L1 cache latency (4 cycles).
We tested with dual random read, as we wanted to see how the memory system coped with multiple read requests. To keep the graph readable we limited ourselves to the CPUs that were different.
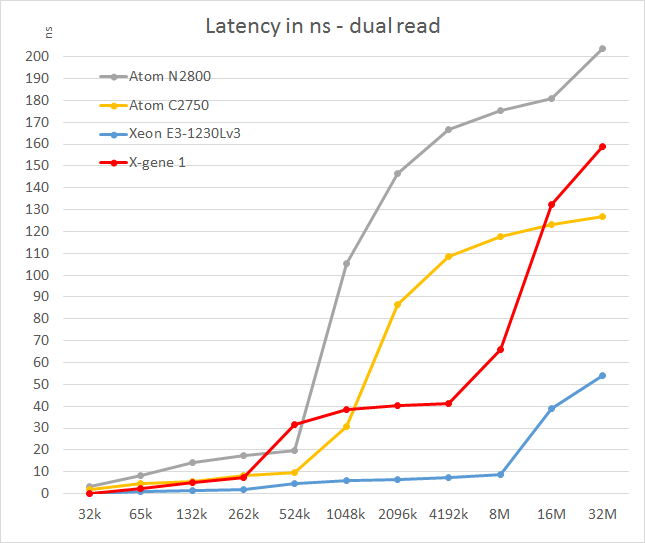
The X-Gene's L2 cache offers slightly better latency than the Atom C2750. That is not surprising as the L2 cache is four times smaller: 256KB vs 1024KB. Still, considering Intel has a lot of experience in building very fast L2 caches and the fact that AMD was never able to match Intel's capabilities, AppliedMicro deserves kudos.
However, the L3 cache seems pretty mediocre: latency tripled and then quadrupled! We are measuring 11-15 cycle latency for the L2 (single read) to 50-80 cycles (single read, up to 100 cycles in dual read) for the L3. Of course, on the C2750 it gets much worse beyond the 1MB mark as that chip has no L3 cache. Still, such a slow L3 cache will hamper performance in quite a few situations. The reason for this is probably that X-Gene links the cores and L3 cache via a coherent network switch instead of a low-latency ring (Intel).
In contrast to the above SoCs, the smart prefetchers of the Xeon E3 keep the latency in check, even at high block sizes. The X-Gene SoC however has the slowest memory controller of the modern SoCs once we go off-chip. Only the old Atom "Saltwell" is slower, where latency is an absolute disaster once the L2 cache (512KB) is not able to deliver the right cachelines.


47 Comments
View All Comments
JohanAnandtech - Tuesday, March 10, 2015 - link
Thanks! It is been a long journey to get all the necessary tests done on different pieces of hardware and it is definitely not complete, but at least we were able to quantify a lot of paper specs. (25 W TDP of Xeon E3, 20W Atom, X-Gene performance etc.)enzotiger - Tuesday, March 10, 2015 - link
SeaMicro focused on density, capacity, and bandwidth.How did you come to that statement? Have you ever benchmark (or even play with) any SeaMicro server? What capacity or bandwidth are you referring to? Are you aware of their plan down the road? Did you read AMD's Q4 earning report?
BTW, AMD doesn't call their server as micro-server anymore. They use the term dense server.
Peculiar - Tuesday, March 10, 2015 - link
Johan, I would also like to congratulate you on a well written and thorough examination of subject matter that is not widely evaluated.That being said, I do have some questions concerning the performance/watt calculations. Mainly, I'm concerned as to why you are adding the idle power of the CPUs in order to obtain the "Power SoC" value. The Power Delta should take into account the difference between the load power and the idle power and therefore you should end up with the power consumed by the CPU in isolation. I can see why you would add in the chipset power since some of the devices are SoCs and do no require a chipset and some are not. However, I do not understand the methodology in adding the idle power back into the Delta value. It seems that you are adding the load power of the CPU to the idle power of the CPU and that is partially why you have the conclusion that they are exceeding their TDPs (not to mention the fact that the chipset should have its own TDP separate from the CPU).
Also, if one were to get nit picky on the power measurements, it is unclear if the load power measurement is peak, average, or both. I would assume that the power consumed by the CPUs may not be constant since you state that "the website load is a very bumpy curve with very short peaks of high CPU load and lots of lows." If possible, it may be more beneficial to measure the energy consumed over the duration of the test.
JohanAnandtech - Wednesday, March 11, 2015 - link
Thanks for the encouragement. About your concerns about the perf/watt calculations. Power delta = average power (high web load measured at 95% percentile = 1 s, an average of about 2 minutes) - idle power. Since idle power = total idle of node, it contains also the idle power of the SoC. So you must add it to get the power of the SoC. If you still have doubts, feel free to mail me.jdvorak - Friday, March 13, 2015 - link
The approach looks absolutely sound to me. The idle power will be drawn in any case, so it makes sense to add it in the calculation. Perhaps it would also be interesting to compare the power consumed by the differents systems at the same load levels, such as 100 req/s, 200 req/s, ... (clearly, some higher loads will not be achievable by all of them).Johan, thanks a lot for this excellent, very informative article! I can imagine how much work has gone into it.
nafhan - Wednesday, March 11, 2015 - link
If these had 10gbit - instead of gbit - NICs, these things could do some interesting stuff with virtual SANs. I'd feel hesitant shuttling storage data over my primary network connection without some additional speed, though.Looking at that moonshot machine, for instance: 45 x 480 SSD's is a decent sized little SAN in a box if you could share most of that storage amongst the whole moonshot cluster.
Anyway, with all the stuff happening in the virtual SAN space, I'm sure someone is working on that.
Casper42 - Wednesday, April 15, 2015 - link
Johan, do you have a full Moonshot 1500 chassis for your testing? Or are you using a PONK?