Z97 Mini-ITX Review at $140: ASRock, MSI and GIGABYTE
by Ian Cutress on July 23, 2014 3:00 AM ESTMany thanks to...
We must thank the following companies for kindly providing hardware for our test bed:
- Thank you to OCZ for providing us with PSUs and SSDs.
- Thank you to G.Skill and ADATA for providing us with memory kits.
- Thank you to Corsair for providing us with an AX1200i PSU, Corsair H80i CLC and DRAM.
- Thank you to ASUS for providing us with the AMD HD7970 GPUs and some IO Testing kit.
- Thank you to MSI for providing us with the NVIDIA GTX 770 Lightning GPUs.
- Thank you to Rosewill for providing us with PSUs and RK-9100 keyboards.
- Thank you to ASRock for providing us with some IO testing kit.
Test Setup
| Test Setup | |
| Processor |
Intel Core i7-4770K ES 4 Cores, 8 Threads, 3.5 GHz (3.9 GHz Turbo) |
| Motherboard |
ASRock Z97E-ITX MSI Z97I AC GIGABYTE Z97N-WiFi |
| Cooling |
Corsair H80i Thermalright TRUE Copper |
| Power Supply |
OCZ 1250W Gold ZX Series Corsair AX1200i Platinum PSU |
| Memory | G.Skill RipjawsZ 4x4 GB DDR3-1600 9-11-9 Kit |
| Memory Settings | 1600 9-11-9-27 1T tRFC 240 |
| Video Cards |
MSI GTX 770 Lightning 2GB (1150/1202 Boost) ASUS HD7970 3GB (Reference) |
| Video Drivers |
Catalyst 13.12 NVIDIA Drivers 335.23 |
| Hard Drive | OCZ Vertex 3 256GB |
| Optical Drive | LG GH22NS50 |
| Case | Open Test Bed |
| Operating System | Windows 7 64-bit SP1 |
| USB 2/3 Testing | OCZ Vertex 3 240GB with SATA->USB Adaptor |
Power Consumption
Power consumption was tested on the system as a whole with a wall meter connected to the OCZ 1250W power supply, while in a single MSI GTX 770 Lightning GPU configuration. This power supply is Gold rated, and as I am in the UK on a 230-240 V supply, leads to ~75% efficiency > 50W, and 90%+ efficiency at 250W, which is suitable for both idle and multi-GPU loading. This method of power reading allows us to compare the power management of the UEFI and the board to supply components with power under load, and includes typical PSU losses due to efficiency. These are the real world values that consumers may expect from a typical system (minus the monitor) using this motherboard.
While this method for power measurement may not be ideal, and you feel these numbers are not representative due to the high wattage power supply being used (we use the same PSU to remain consistent over a series of reviews, and the fact that some boards on our test bed get tested with three or four high powered GPUs), the important point to take away is the relationship between the numbers. These boards are all under the same conditions, and thus the differences between them should be easy to spot.
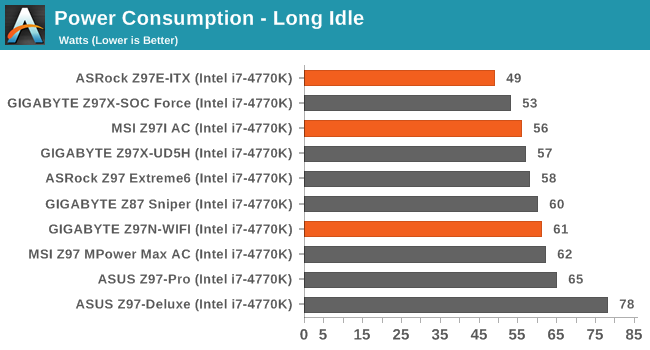
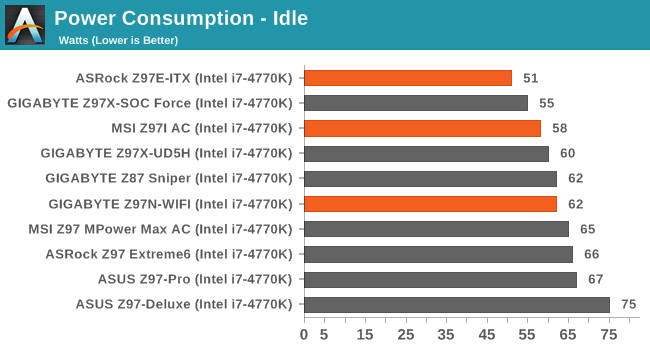
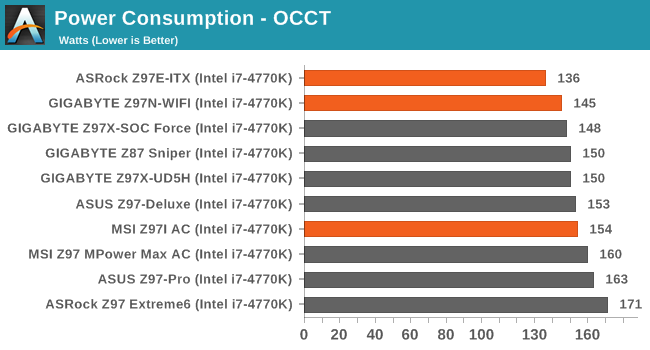
The ASRock motherboard scores the lowest in our power tests with impressive idle numbers. However, the GIGABYTE has the smalled power delta between idle and loaded conditions.
Windows 7 POST Time
Different motherboards have different POST sequences before an operating system is initialized. A lot of this is dependent on the board itself, and POST boot time is determined by the controllers on board (and the sequence of how those extras are organized). As part of our testing, we are now going to look at the POST Boot Time - this is the time from pressing the ON button on the computer to when Windows 7 starts loading. (We discount Windows loading as it is highly variable given Windows specific features.) These results are subject to human error, so please allow +/- 1 second in these results.
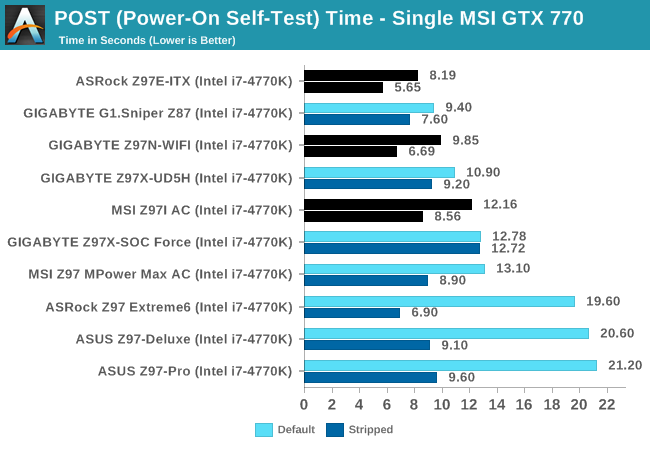
Smaller systems should boot quickly (in an ideal scenario), and in this case the ASRock takes both the default and stripped top places. For the default scenario, this may be indicative of having one less NIC than the other two, saving some time. In fact, the 5.65 seconds of the ASRock board when stripped down is mightily impressive.
Rightmark Audio Analyzer 6.2.5
The premise behind Rightmark:AA is to test the input and output of the audio system to determine noise levels, range, harmonic distortion, stereo crosstalk and so forth. Rightmark:AA should indicate how well the sound system is built and isolated from electrical interference (either internally or externally). For this test we connect the Line Out to the Line In using a short six inch 3.5mm to 3.5mm high-quality jack, turn the OS speaker volume to 100%, and run the Rightmark default test suite at 192 kHz, 24-bit. The OS is tuned to 192 kHz/24-bit input and output, and the Line-In volume is adjusted until we have the best RMAA value in the mini-pretest. We look specifically at the Dynamic Range of the audio codec used on board, as well as the Total Harmonic Distortion + Noise.
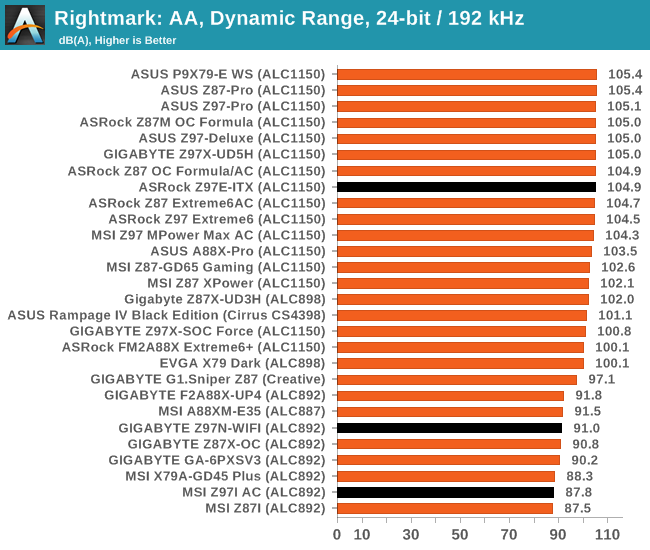
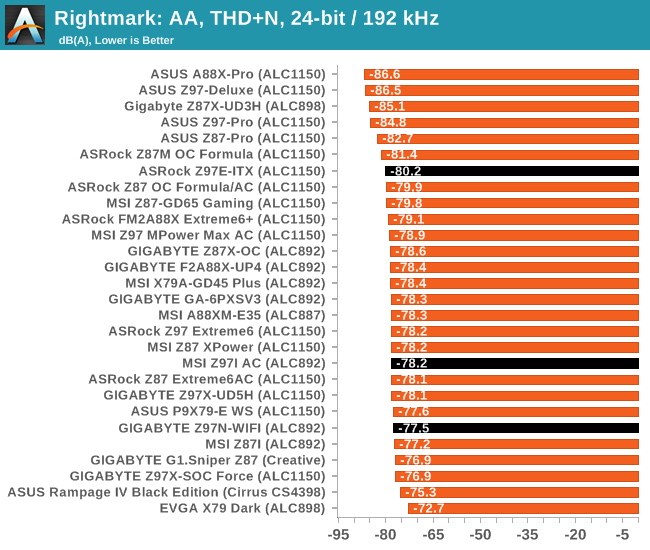
The use of a Realtek ALC1150 pushes the ASRock ahead of the other two quite easily in terms of dynamic range and distortion.
USB Backup
For this benchmark, we run CrystalDiskMark to determine the ideal sequential read and write speeds for the USB port using our 240 GB OCZ Vertex3 SSD with a SATA 6 Gbps to USB 3.0 converter. Then we transfer a set size of files from the SSD to the USB drive using DiskBench, which monitors the time taken to transfer. The files transferred are a 1.52 GB set of 2867 files across 320 folders – 95% of these files are small typical website files, and the rest (90% of the size) are the videos used in the WinRAR test. In an update to pre-Z87 testing, we also run MaxCPU to load up one of the threads during the test which improves general performance up to 15% by causing all the internal pathways to run at full speed.
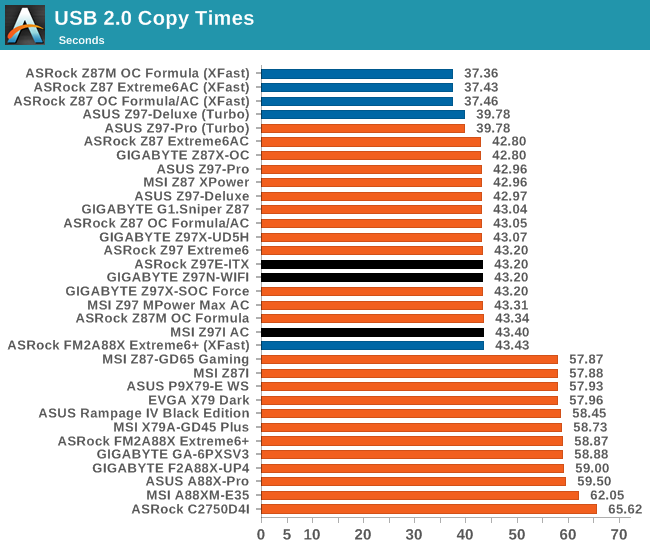
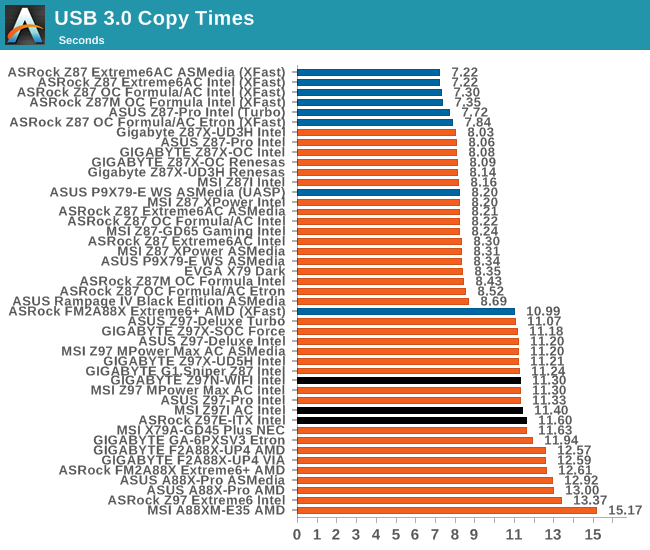
Nothing much separates the three boards in USB speed.
DPC Latency
Deferred Procedure Call latency is a way in which Windows handles interrupt servicing. In order to wait for a processor to acknowledge the request, the system will queue all interrupt requests by priority. Critical interrupts will be handled as soon as possible, whereas lesser priority requests, such as audio, will be further down the line. So if the audio device requires data, it will have to wait until the request is processed before the buffer is filled. If the device drivers of higher priority components in a system are poorly implemented, this can cause delays in request scheduling and process time, resulting in an empty audio buffer – this leads to characteristic audible pauses, pops and clicks. Having a bigger buffer and correctly implemented system drivers obviously helps in this regard. The DPC latency checker measures how much time is processing DPCs from driver invocation – the lower the value will result in better audio transfer at smaller buffer sizes. Results are measured in microseconds and taken as the peak latency while cycling through a series of short HD videos - less than 500 microseconds usually gets the green light, but the lower the better.
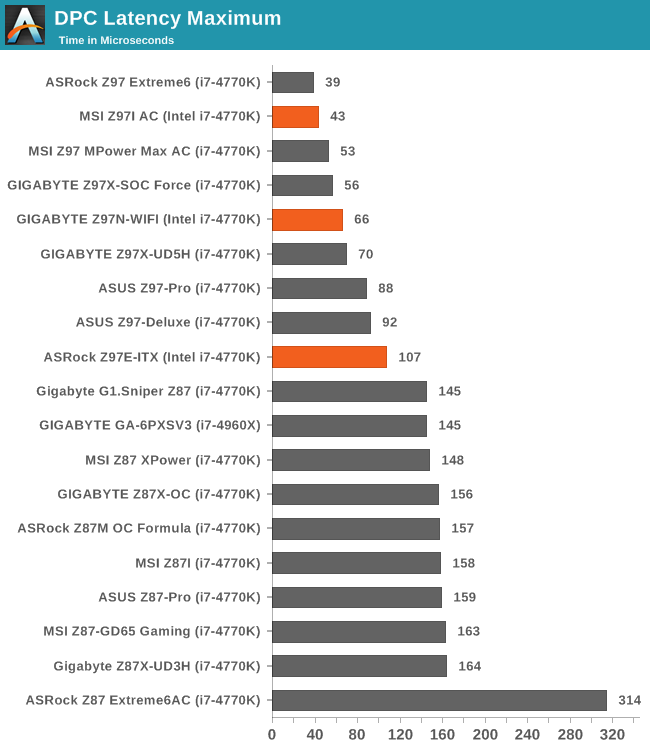
Intel’s 9-series motherboards are all scoring well in DPC Latency. Out of the three motherboards tested here, the MSI takes the crown with a sub 50 score. The ASRock is almost triple, slightly outside our new byline of 100, at 107.


38 Comments
View All Comments
The_Assimilator - Friday, July 25, 2014 - link
Embedded boards' DC-to-DC circuitry won't handle the high amperages required by e.g. modern graphics cards. You also won't find people running 12-drive RAID arrays off them, for the same reason. It's certainly possible to increase the capacity of the DC-to-DC converters, but then you need heatsinks and whatnot and before you know it you've integrated a switching mode power supply into your motherboard.The_Assimilator - Friday, July 25, 2014 - link
BTX failed because it was merely a revision of the ATX form factor, not ATX power delivery. What we need is the reverse - leave the form factor alone (it ain't broke) but bring the obviously-outdated power delivery spec up to scratch.Oxford Guy - Saturday, January 23, 2016 - link
The form factor is subpar for GPU cooling.owan - Wednesday, July 23, 2014 - link
When I saw this review on the front page and saw the Z97n-wifi I got a bit nervous since I just purchased one of these to go along with a G3258 for a little overclocking/backup gaming system. Glad to see it fares well, I was just as pleasantly surprised by its layout as you wereDiHydro - Wednesday, July 23, 2014 - link
In the "GIGABYTE Z97N-WIFI Performance" section, what is the red colored "1m44" result for OCCT mean?DiHydro - Wednesday, July 23, 2014 - link
Oh, I think I see. It is the time the test ran before the thermal limit was reached.Wixman666 - Wednesday, July 23, 2014 - link
After 1 min 44 seconds it overheated and started throttling.abugarcia - Wednesday, July 23, 2014 - link
FYI, some of the links on the Test Setup table lead to the incorrect products when clicked (i7-4770k and MSI GTX 770 Lightning). Looks like its this way on some older reviews as well.Ian Cutress - Wednesday, July 23, 2014 - link
Ah rats, copy/paste error from some other test setup tables I had. Fixed here, will go back to some of the older reviews. Nice spot :)Ubercake - Wednesday, July 23, 2014 - link
As more and more controllers are integrated on the CPU, one value-add I wish the motherboard manufacturers would integrate with the system board is TV-tuner functionality.