The AMD Radeon R7 265 & R7 260 Review: Feat Sapphire & Asus
by Ryan Smith on February 13, 2014 8:00 AM ESTCompute
Jumping into compute, we’re once again treading into familar territory. Pitcairn and Bonaire are Pitcairn and Bonaire, so this will result in the same general performance differences we've seen elsewhere.
As always we'll start with our DirectCompute game example, Civilization V, which uses DirectCompute to decompress textures on the fly. Civ V includes a sub-benchmark that exclusively tests the speed of their texture decompression algorithm by repeatedly decompressing the textures required for one of the game’s leader scenes. While DirectCompute is used in many games, this is one of the only games with a benchmark that can isolate the use of DirectCompute and its resulting performance.
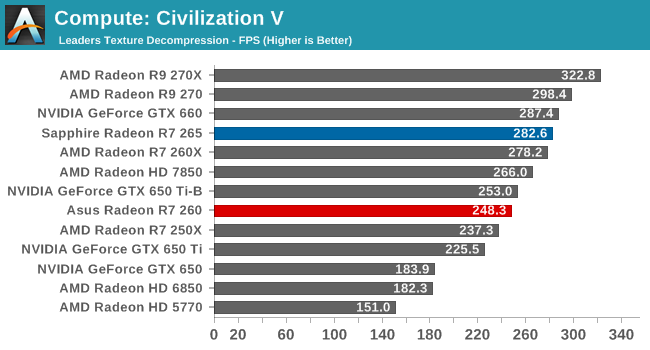
Similar to the 3DMark pixel throughput test on the last page, the Civilization V texture decompression tests highlights the fact that the R7 265 and R7 260X are closer than one would expect in certain edge cases. Once again the R7 260X’s higher clockspeed is helping it keep the gap between it and the R7 265 very narrow, as the two have very similar shader throughput in the end.
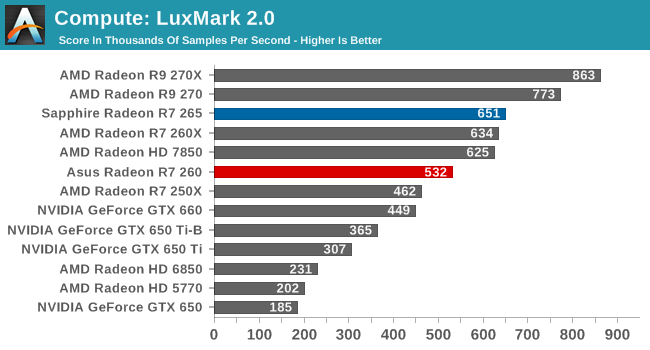
The story is much the same with LuxMark as it was Civilization V, with AMD cards once again being sorted almost exactly by shader throughput. Though it’s worth pointing out that NVIDIA’s performance under LuxMark has greatly improved as of the R334 drivers. It’s not enough to close the gap with AMD, but it’s closer than it once was.
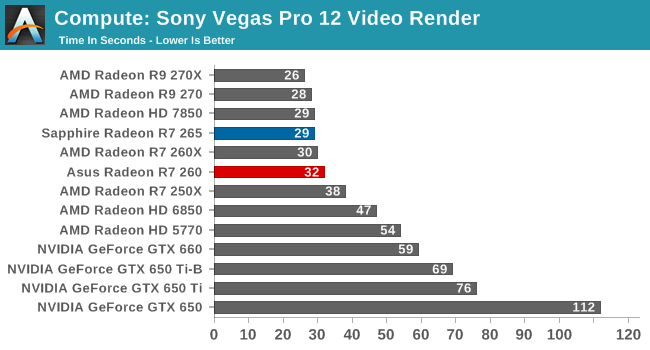
Like LuxMark, Sony Vegas is a benchmark dominated by AMD. The lead here is so great that the R7 265 could run this benchmark twice over before the GTX 660 completed it once. Nor would the R7 260 be too far behind in that respect.
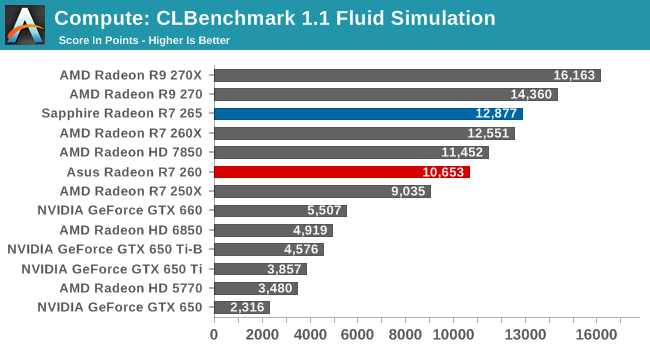
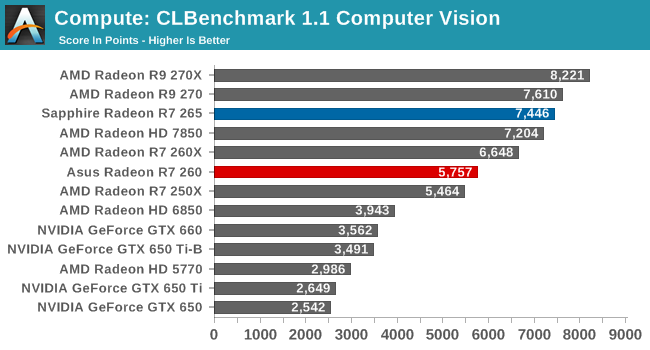
Both CLBenchmark’s fluid simulation benchmark and the computer vision benchmark go to AMD here. The GTX 650 Ti and GTX 660 are not competitive here.
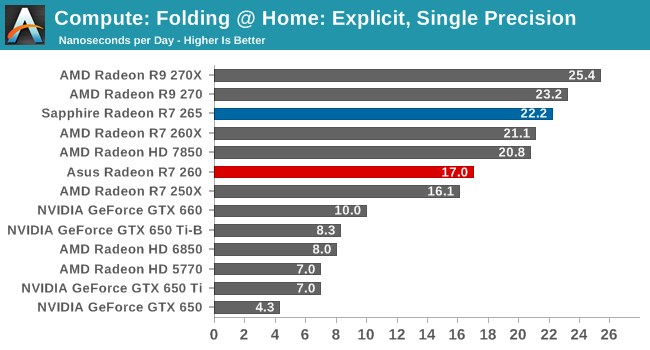
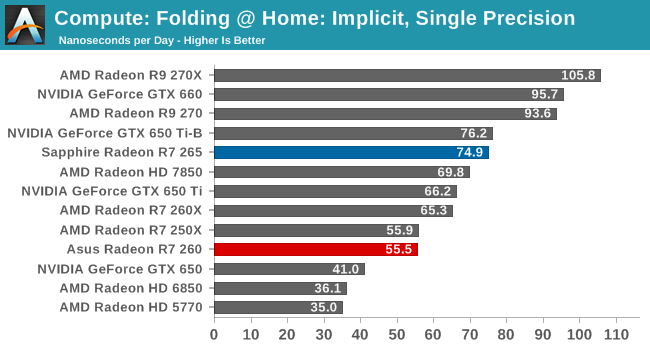
With AMD’s Catalyst 14.1 drivers, AMD has been able to increase their Folding @ Home performance by several percent, closing some gaps while widening others. In the Explicit SP benchmark AMD further increases their lead here, with even the lowly R7 250X holding a significant lead over the GTX 660. On the other hand the R7 265 can’t come close to the GTX 660 under Implicit SP; there’s a lack of raw shader throughput to make it happen.
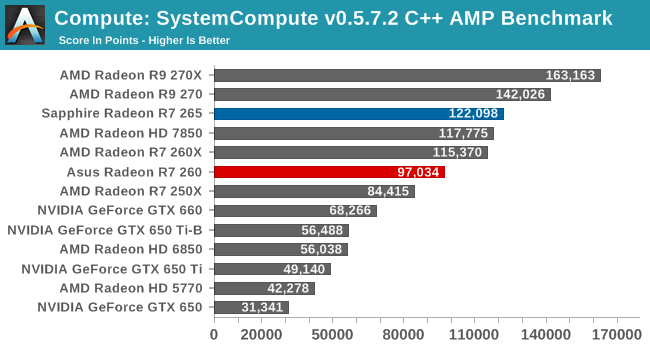
SystemCompute is another compute benchmark that goes to AMD. The R7 265 and R7 260 handily beat the GTX 660, never mind the GTX 650 Ti.


52 Comments
View All Comments
TheJian - Wednesday, February 19, 2014 - link
How is that possible when all of the pricing is fake? You are ignoring REAL pricing much like anandtech. They should draw conclusions based on REAL pricing, and ignore ALL companies MSRP. If I can't buy it, it's still fake until I can for MSRP. IE, 290x is $700 right now (actually $709 cheapest on amazon - 3 in stock), NOT $550. So reviews based on $550 pricing are not real. Anandtech continues to give the benefit of the doubt 'one day it might be MSRP and a good deal if they can get to MSRP quickly'...LOL. Is a $709 290x a good deal vs. 780ti? NOPE.thejoelhansen - Saturday, April 26, 2014 - link
I hope I didn't overlook something obvious, but are the GTX 760 results missing?