OCZ Vector 150 (120GB & 240GB) Review
by Kristian Vättö on November 7, 2013 9:00 AM EST- Posted in
- Storage
- SSDs
- OCZ
- Indilinx
- Vector 150
AnandTech Storage Bench 2011
Several years ago we introduced our AnandTech Storage Bench, a suite of benchmarks that took traces of real OS/application usage and played them back in a repeatable manner. Anand personally assembled the traces out of frustration with the majority of what we have today in terms of SSD benchmarks.
Although the AnandTech Storage Bench tests did a good job of characterizing SSD performance, they weren't stressful enough. All of the tests performed less than 10GB of reads/writes and typically involved only 4GB of writes specifically. That's not even enough exceed the spare area on most SSDs. Most canned SSD benchmarks don't even come close to writing a single gigabyte of data, but that doesn't mean that simply writing 4GB is acceptable.
Originally we kept the benchmarks short enough that they wouldn't be a burden to run (~30 minutes) but long enough that they were representative of what a power user might do with their system.
The next step was to create what we referred to as the Mother of All SSD Benchmarks (MOASB). Rather than only writing 4GB of data to the drive, this benchmark writes 106.32GB. It's the load you'd put on a drive after nearly two weeks of constant usage. And it takes a long time to run.
The MOASB, officially called AnandTech Storage Bench 2011 - Heavy Workload, mainly focuses on the times when your I/O activity is the highest. There is a lot of downloading and application installing that happens during the course of this test. The thinking was that it's during application installs, file copies, downloading and multitasking with all of this that you can really notice performance differences between drives.
We tried to cover as many bases as possible with the software incorporated into this test. There's a lot of photo editing in Photoshop, HTML editing in Dreamweaver, web browsing, game playing/level loading (Starcraft II & WoW are both a part of the test) as well as general use stuff (application installing, virus scanning). We included a large amount of email downloading, document creation and editing as well. To top it all off we even use Visual Studio 2008 to build Chromium during the test.
The test has 2,168,893 read operations and 1,783,447 write operations. The IO breakdown is as follows:
| AnandTech Storage Bench 2011 - Heavy Workload IO Breakdown | ||||
| IO Size | % of Total | |||
| 4KB | 28% | |||
| 16KB | 10% | |||
| 32KB | 10% | |||
| 64KB | 4% | |||
Only 42% of all operations are sequential, the rest range from pseudo to fully random (with most falling in the pseudo-random category). Average queue depth is 4.625 IOs, with 59% of operations taking place in an IO queue of 1.
Many of you have asked for a better way to really characterize performance. Simply looking at IOPS doesn't really say much. As a result we're going to be presenting Storage Bench 2011 data in a slightly different way. We'll have performance represented as Average MB/s, with higher numbers being better. At the same time we'll be reporting how long the SSD was busy while running this test. These disk busy graphs will show you exactly how much time was shaved off by using a faster drive vs. a slower one during the course of this test. Finally, we will also break out performance into reads, writes and combined. The reason we do this is to help balance out the fact that this test is unusually write intensive, which can often hide the benefits of a drive with good read performance.
There's also a new light workload for 2011. This is a far more reasonable, typical every day use case benchmark. Lots of web browsing, photo editing (but with a greater focus on photo consumption), video playback as well as some application installs and gaming. This test isn't nearly as write intensive as the MOASB but it's still multiple times more write intensive than what we were running in 2010.
These two benchmarks alone are not enough to characterize the performance of a drive, but hopefully along with the rest of our tests they will help provide a better idea. The testbed for Storage Bench 2011 has changed as well. We're now using a Sandy Bridge platform with full 6Gbps support for these tests.
AnandTech Storage Bench 2011 - Heavy Workload
We'll start out by looking at average data rate throughout our heavy workload test:
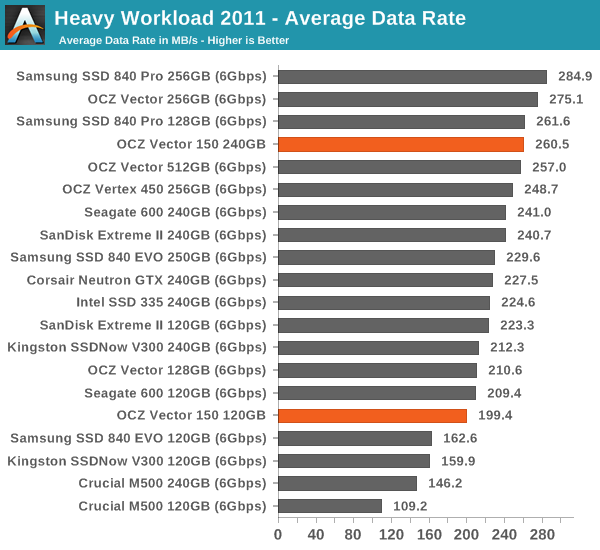
The Vector 150 is a bit slower than the original Vector in our 2011 Heavy workload test but the difference isn't significant. The slight performance loss here is compensated for by the increased IO consistency. I decided not to include all of the graphs here since the average data rate is the only truly meaningful data point these days but you can still find the complete dataset in our Bench.
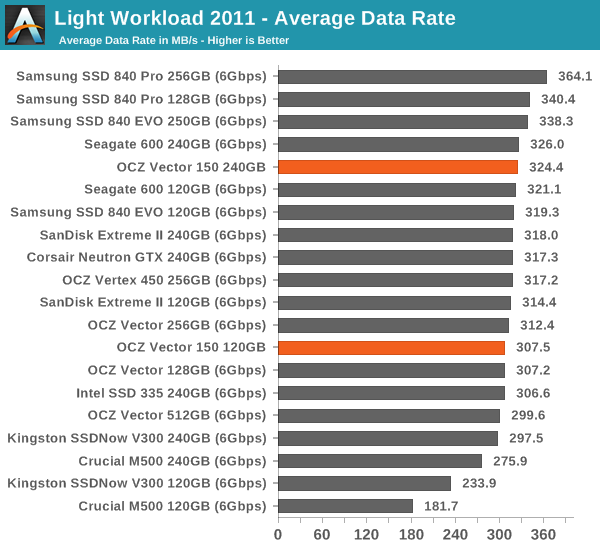
AnandTech Storage Bench 2011 - Light Workload
Our light workload actually has more write operations than read operations. The split is as follows: 372,630 reads and 459,709 writes. The relatively close read/write ratio does better mimic a typical light workload (although even lighter workloads would be far more read centric). The I/O breakdown is similar to the heavy workload at small IOs, however you'll notice that there are far fewer large IO transfers:
| AnandTech Storage Bench 2011 - Light Workload IO Breakdown | ||||
| IO Size | % of Total | |||
| 4KB | 27% | |||
| 16KB | 8% | |||
| 32KB | 6% | |||
| 64KB | 5% | |||


59 Comments
View All Comments
Kristian Vättö - Friday, November 8, 2013 - link
Actually, I've already tested the Intel SSD 530 and am just waiting for Intel to confirm a few things so I can push the review live. I didn't want to include the results here as it kind of ruins the idea of a review if all the scores have been published beforehand. But you should expect the review to surface early next week :)HisDivineOrder - Thursday, November 7, 2013 - link
OCZ's been taking a beating in profits. If you look at the sheer number of refurb deals on OCZ drives as of late, it looks like they're dumping their inventory at reduced prices with virtually no warranties, hoping to clear out warehouses. They're trying to make a quick buck in a hurry because their stock is taking a beating after their profits didn't line up.I'd say this might be one of the last times you read an OCZ SSD review.
Bob Todd - Thursday, November 7, 2013 - link
My only truly horrid SSD experience has been with an Agility 4. Data corruption, randomly not even appearing in the BIOS (on common Intel SATA controllers), etc. RMA'd it once. The replacement did the same thing. RMA'd that one too. The third one is just as bad, and it's sitting in a desk drawer until I get around to sending it back yet again. That's with the latest firmware. Completely anecdotal of course, but 3 bad drives in a row from OCZ when I've never had similar issues with a larger set of drives from Crucial, Plextor, and Kingston.Souka - Thursday, November 7, 2013 - link
Reminds me of the Hitachi Deathstar...er Deskstar drive series... click click clck...gus6464 - Thursday, November 7, 2013 - link
Who in their right mind would buy an OCZ drive over a Samsung, Intel, Crucial, Sandisk, Plextor?wonderblue - Thursday, November 7, 2013 - link
I must be the only person on the planet who bought an OCZ SSD and didn't have it fail.128GB vertex 3 going strong for a year so far.
killerroach - Thursday, November 7, 2013 - link
I still boot my desktop off of a 60GB Vertex. Not a Vertex 3, Vertex 2... original Vertex. Still going strong.evonitzer - Friday, November 8, 2013 - link
Yeah, I feel like I'm the luckiest guy around with my OCZ. Or else (gasp!) these comments exaggerate the situation a wee bit.kmmatney - Friday, November 8, 2013 - link
I still have a 60GB Agility 2 running fine, although I've been using it as a giant external USB memory stick for the last year (using a USB to SATA adapter that came with a Samsung SSD). It's work amazing as a memory stick, copying files at about 30mb/sec on USB 2.Gigaplex - Friday, November 8, 2013 - link
My Agility 3 is still going too *fingers crossed*