Intel SSD 335 (240GB) Review
by Kristian Vättö on October 29, 2012 11:30 AM ESTAnandTech Storage Bench 2011
Last year we introduced our AnandTech Storage Bench, a suite of benchmarks that took traces of real OS/application usage and played them back in a repeatable manner. Anand assembled the traces out of frustration with the majority of what we have today in terms of SSD benchmarks.
Although the AnandTech Storage Bench tests did a good job of characterizing SSD performance, they weren't stressful enough. All of the tests performed less than 10GB of reads/writes and typically involved only 4GB of writes specifically. That's not even enough exceed the spare area on most SSDs. Most canned SSD benchmarks don't even come close to writing a single gigabyte of data, but that doesn't mean that simply writing 4GB is acceptable.
Originally we kept the benchmarks short enough that they wouldn't be a burden to run (~30 minutes) but long enough that they were representative of what a power user might do with their system. Later, however, we created what we refer to as the Mother of All SSD Benchmarks (MOASB). Rather than only writing 4GB of data to the drive, this benchmark writes 106.32GB. This represents the load you'd put on a drive after nearly two weeks of constant usage. And it takes a long time to run.
1) The MOASB, officially called AnandTech Storage Bench 2011—Heavy Workload, mainly focuses on the times when your I/O activity is the highest. There is a lot of downloading and application installing that happens during the course of this test. Our thinking was that it's during application installs, file copies, downloading, and multitasking with all of this that you can really notice performance differences between drives.
2) We tried to cover as many bases as possible with the software incorporated into this test. There's a lot of photo editing in Photoshop, HTML editing in Dreamweaver, web browsing, game playing/level loading (Starcraft II and WoW are both a part of the test), as well as general use stuff (application installing, virus scanning). We included a large amount of email downloading, document creation, and editing as well. To top it all off we even use Visual Studio 2008 to build Chromium during the test.
The test has 2,168,893 read operations and 1,783,447 write operations. The IO breakdown is as follows:
| AnandTech Storage Bench 2011—Heavy Workload IO Breakdown | ||||
| IO Size | % of Total | |||
| 4KB | 28% | |||
| 16KB | 10% | |||
| 32KB | 10% | |||
| 64KB | 4% | |||
Only 42% of all operations are sequential; the rest ranges from pseudo to fully random (with most falling in the pseudo-random category). Average queue depth is 4.625 IOs, with 59% of operations taking place in an IO queue of 1.
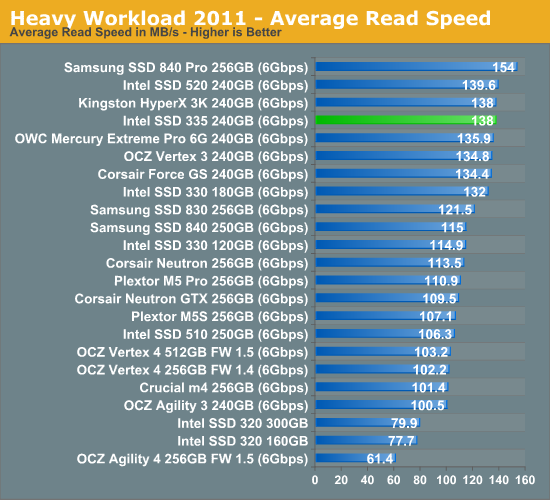
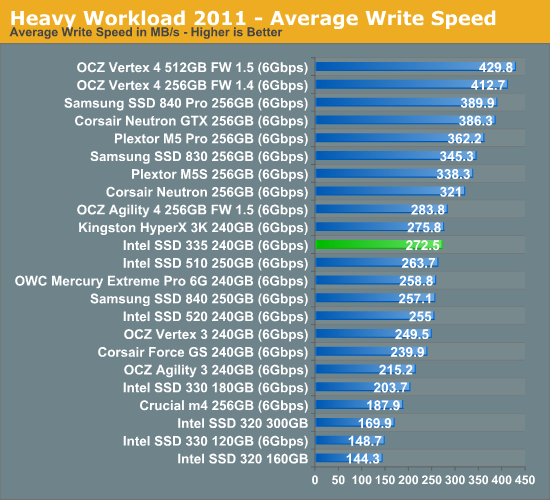
Many of you have asked for a better way to really characterize performance. Simply looking at IOPS doesn't really say much. As a result we're going to be presenting Storage Bench 2011 data in a slightly different way. We'll have performance represented as Average MB/s, with higher numbers being better. At the same time we'll be reporting how long the SSD was busy while running this test. These disk busy graphs will show you exactly how much time was shaved off by using a faster drive vs. a slower one during the course of this test. Finally, we will also break out performance into reads, writes, and combined. The reason we do this is to help balance out the fact that this test is unusually write intensive, which can often hide the benefits of a drive with good read performance.
There's also a new light workload for 2011. This is a far more reasonable, typical every day use case benchmark. It has lots of web browsing, photo editing (but with a greater focus on photo consumption), video playback, as well as some application installs and gaming. This test isn't nearly as write intensive as the MOASB but it's still multiple times more write intensive than what we were running last year.
We don't believe that these two benchmarks alone are enough to characterize the performance of a drive, but hopefully along with the rest of our tests they will help provide a better idea. The testbed for Storage Bench 2011 has changed as well. We're now using a Sandy Bridge platform with full 6Gbps support for these tests.
AnandTech Storage Bench 2011—Heavy Workload
We'll start out by looking at average data rate throughout our new heavy workload test:
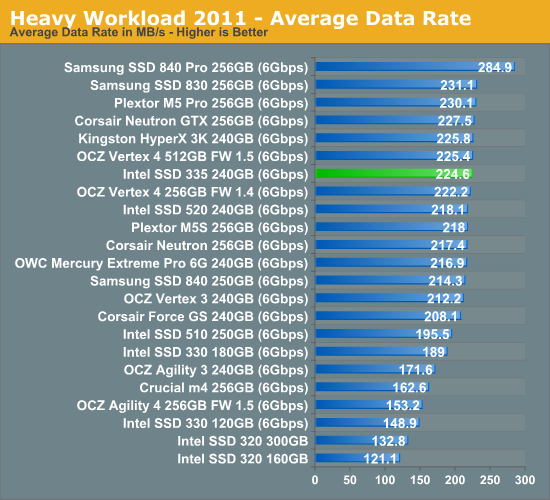
The SSD 335 performs very well in our Heavy suite. It's on-par with most high-end SSDs and even manages to beat the 520 and 330. The improvement over the 330 is quite good.
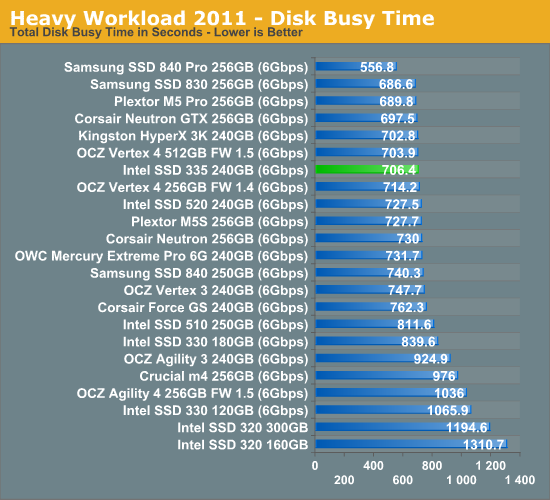
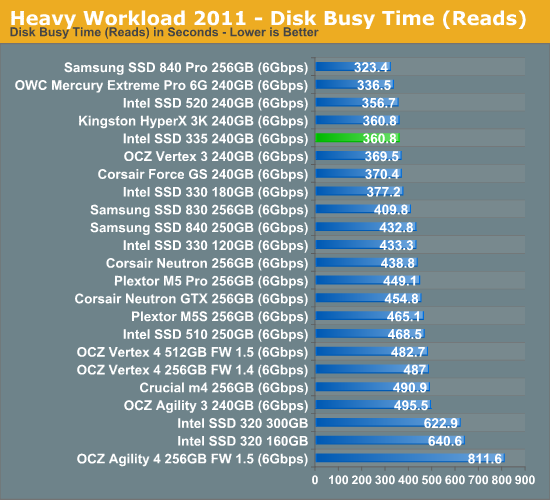
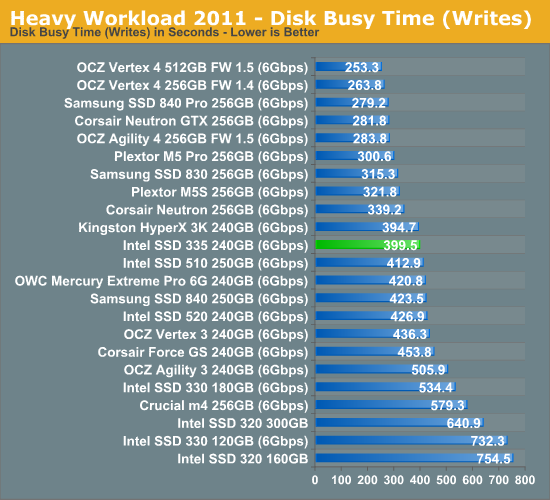
The next three charts just represent the same data, but in a different manner. Instead of looking at average data rate, we're looking at how long the disk was busy for during this entire test. Note that disk busy time excludes any and all idles, this is just how long the SSD was busy doing something:


69 Comments
View All Comments
Per Hansson - Tuesday, October 30, 2012 - link
No, it does not work like that.A slow DMM might take a reading every second.
An example, in seconds:
1: 2w
2: 2w
3: 2w
Average=2w
A fast DMM might take readings every 100ms:
1: 2w
2: 0.5w
3: 2w
4: 0.5w
Average=1w
As you see a DMM does not take a continous reading, it takes readings at points in time and averages those...
An SSD drive might actually change power levels much more frequently, like every millisencond (consider their performance, how long does it take to write 4KB of data as an example?)
hrga - Thursday, November 1, 2012 - link
dont think SSD even try to write such a small amount of data as 4kB every milisecond considering how large buffers usually have 128GB LPDDR2. So thes kind of small writes occur in bursts when they accumulate every 15-30s (at least hope so as this was case with hard drives) That ofc depends on firmware and values in it.Per Hansson - Thursday, November 1, 2012 - link
That makes no difference, I sincerely hope that no drive waits 15 > 30 seconds to write data to disk because that is just a recipe for data loss in case of power failure or BSOD.I also hope no drive uses a 128GB write cache. (Intel's in house controller keeps no user data in cache as an example, but I digress)
Even if the drive waits a minute before it writes the 4KB of data you must still have a DMM capable of catching that write, which is completed in less than a millisecond.
Otherwise the increased power consumption during the disk write will be completely missed by the DMM
Mr Alpha - Monday, October 29, 2012 - link
Wouldn't it make more sense to the idle power consumption on a platform that supports DPIM? The idle power usage is mostly a matter on mobile devices, and it is on those you get DPIM support.sheh - Monday, October 29, 2012 - link
The text says total writes were 1.2TB, (+3.8TB=) 5TB, and 37.8TB. The screenshots show "host writes" at 1.51TB, 2.11TB, and 3.90TB?sheh - Monday, October 29, 2012 - link
And why the odd power on hours counts?Kristian Vättö - Monday, October 29, 2012 - link
You are mixing host writes with the actual NAND writes. Host writes are the data that the host (e.g. an operating system) sends to the SSD controller to write. NAND writes show much is written to the NAND.When the SSD is pushed to a corner like I did, you will end up having more NAND writes than host writes because of read-modify-write (i.e. all user-accessible LBAs are already full, so the controller must read the block to a cache, modify the data and rewrite the block). Basically, your host may be telling the controller to write 4KB but the controller ends up writing 2048MB (that's the block size).
extide - Monday, October 29, 2012 - link
Block size is 2048KB*sheh - Monday, October 29, 2012 - link
So the write amplification in the end was x9.7?Are NAND writes also reported by SMART?
And with the messed up power on count, how can you know the rest of the SMART data is reliable?
Kristian Vättö - Tuesday, October 30, 2012 - link
Yes, write amplification was around 9.7x in the end. That makes sense because the drive becomes more and more fragmented the more you write to it.As you can see in the screenshots, the SMAT value F9 corresponds to NAND writes. Most manufacturers don't report this data, though.
We just have to assume that the values are correct. Otherwise we could doubt every single test result we get, which would make reviewing impossible. The data makes sense so at least it's not screaming that something is off, and from what I have read, we aren't the only site who noticed weird endurance behavior.