Intel SSD 335 (240GB) Review
by Kristian Vättö on October 29, 2012 11:30 AM ESTAnandTech Storage Bench 2011
Last year we introduced our AnandTech Storage Bench, a suite of benchmarks that took traces of real OS/application usage and played them back in a repeatable manner. Anand assembled the traces out of frustration with the majority of what we have today in terms of SSD benchmarks.
Although the AnandTech Storage Bench tests did a good job of characterizing SSD performance, they weren't stressful enough. All of the tests performed less than 10GB of reads/writes and typically involved only 4GB of writes specifically. That's not even enough exceed the spare area on most SSDs. Most canned SSD benchmarks don't even come close to writing a single gigabyte of data, but that doesn't mean that simply writing 4GB is acceptable.
Originally we kept the benchmarks short enough that they wouldn't be a burden to run (~30 minutes) but long enough that they were representative of what a power user might do with their system. Later, however, we created what we refer to as the Mother of All SSD Benchmarks (MOASB). Rather than only writing 4GB of data to the drive, this benchmark writes 106.32GB. This represents the load you'd put on a drive after nearly two weeks of constant usage. And it takes a long time to run.
1) The MOASB, officially called AnandTech Storage Bench 2011—Heavy Workload, mainly focuses on the times when your I/O activity is the highest. There is a lot of downloading and application installing that happens during the course of this test. Our thinking was that it's during application installs, file copies, downloading, and multitasking with all of this that you can really notice performance differences between drives.
2) We tried to cover as many bases as possible with the software incorporated into this test. There's a lot of photo editing in Photoshop, HTML editing in Dreamweaver, web browsing, game playing/level loading (Starcraft II and WoW are both a part of the test), as well as general use stuff (application installing, virus scanning). We included a large amount of email downloading, document creation, and editing as well. To top it all off we even use Visual Studio 2008 to build Chromium during the test.
The test has 2,168,893 read operations and 1,783,447 write operations. The IO breakdown is as follows:
| AnandTech Storage Bench 2011—Heavy Workload IO Breakdown | ||||
| IO Size | % of Total | |||
| 4KB | 28% | |||
| 16KB | 10% | |||
| 32KB | 10% | |||
| 64KB | 4% | |||
Only 42% of all operations are sequential; the rest ranges from pseudo to fully random (with most falling in the pseudo-random category). Average queue depth is 4.625 IOs, with 59% of operations taking place in an IO queue of 1.
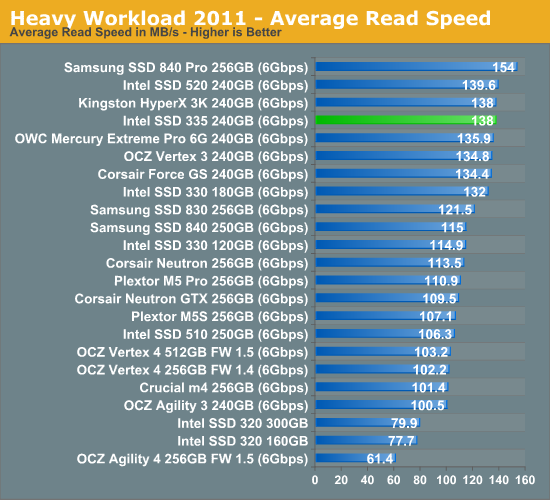
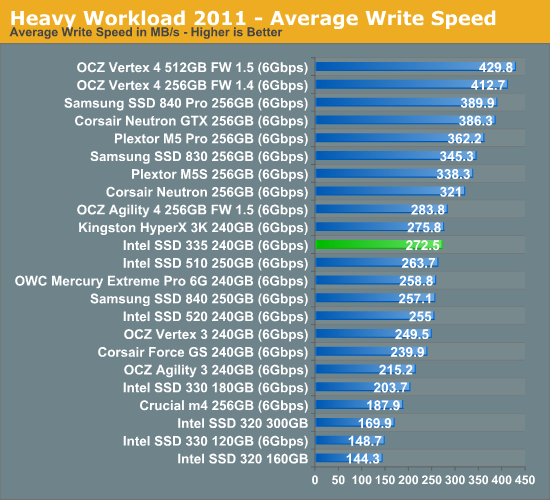
Many of you have asked for a better way to really characterize performance. Simply looking at IOPS doesn't really say much. As a result we're going to be presenting Storage Bench 2011 data in a slightly different way. We'll have performance represented as Average MB/s, with higher numbers being better. At the same time we'll be reporting how long the SSD was busy while running this test. These disk busy graphs will show you exactly how much time was shaved off by using a faster drive vs. a slower one during the course of this test. Finally, we will also break out performance into reads, writes, and combined. The reason we do this is to help balance out the fact that this test is unusually write intensive, which can often hide the benefits of a drive with good read performance.
There's also a new light workload for 2011. This is a far more reasonable, typical every day use case benchmark. It has lots of web browsing, photo editing (but with a greater focus on photo consumption), video playback, as well as some application installs and gaming. This test isn't nearly as write intensive as the MOASB but it's still multiple times more write intensive than what we were running last year.
We don't believe that these two benchmarks alone are enough to characterize the performance of a drive, but hopefully along with the rest of our tests they will help provide a better idea. The testbed for Storage Bench 2011 has changed as well. We're now using a Sandy Bridge platform with full 6Gbps support for these tests.
AnandTech Storage Bench 2011—Heavy Workload
We'll start out by looking at average data rate throughout our new heavy workload test:
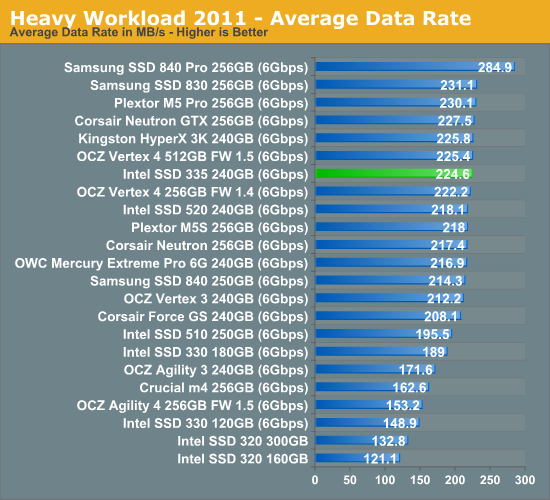
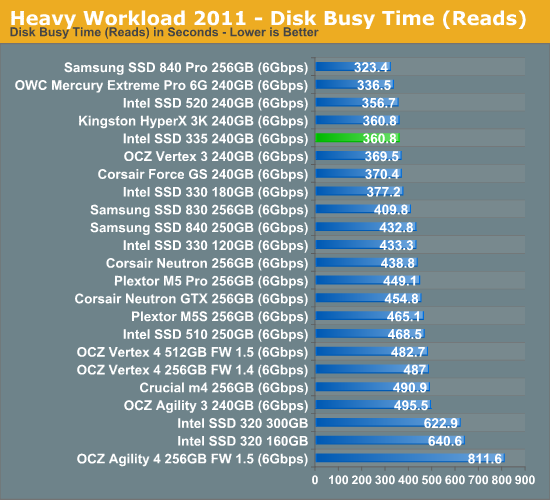
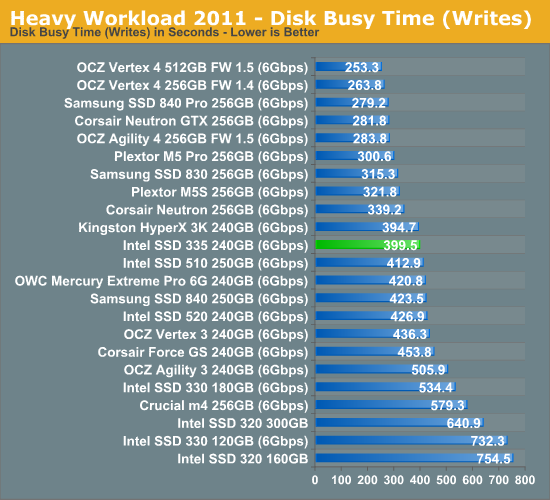
The SSD 335 performs very well in our Heavy suite. It's on-par with most high-end SSDs and even manages to beat the 520 and 330. The improvement over the 330 is quite good.
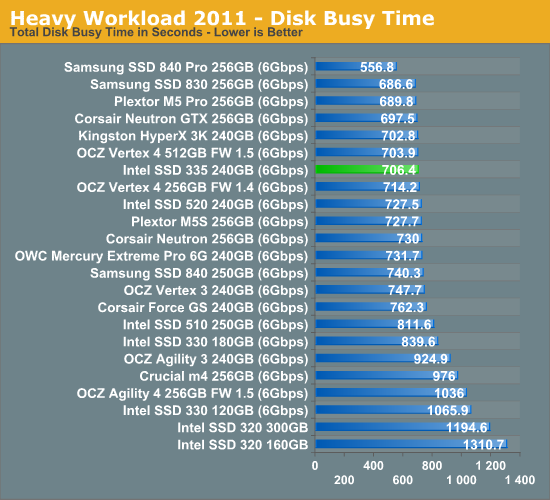
The next three charts just represent the same data, but in a different manner. Instead of looking at average data rate, we're looking at how long the disk was busy for during this entire test. Note that disk busy time excludes any and all idles, this is just how long the SSD was busy doing something:


69 Comments
View All Comments
MichaelD - Tuesday, October 30, 2012 - link
I agree! Take Corsair for example; they've got like a hundred (sic) different SKU's. "Force" "Subforce" "Battle" "Skeedaddle" and "Primo" versions of SSDs...marketing FUD at it's finest. Only the .5% of SSD buyers (like AT readers) will actually look at specs and decide. The other 99.5% will just buy whatever box has the "fastest looking" cover art.zanon - Monday, October 29, 2012 - link
Now they just get giggle-stomped across the board by Samsung. I hope Intel decides to be competitive again someday, but in the mean time it's hard to see any reason to bother.MadMan007 - Monday, October 29, 2012 - link
Read past the sythetics to real-world tests. It is at least competitive in most cases, and all these drives are stupid fast anyway.jeffbui - Monday, October 29, 2012 - link
Why is there such a discrepancy between the power consumption figures given by the manufacturer vs what you're getting from your testing? (Samsung mostly) Other websites are getting completely different power usage figures as well.DanNeely - Monday, October 29, 2012 - link
Comments on one of AT's other recent SSD articles claimed this is because the power consumption test is being done using an external enclosure that never lets the drive drop into it's lowest power states. I didn't see any official comment on it.Kristian Vättö - Monday, October 29, 2012 - link
Some manufacturers such as Samsung report their power numbers with DIPM/HIPM (Device/Host Initiated Link Power Management) enabled, which can lower the power consumption significantly. DIPM/HIPM are not enabled on desktop by default and I'm not sure if all laptops have them enabled either.We have ran tests with DIPM/HIPM enabled and gotten results similar to what manufacturers report, but so far we have kept on publishing numbers with DIPM/HIPM disabled. We will probably add DIPM/HIPM numbers once we redo our SSD testing methodology.
DanNeely - Monday, October 29, 2012 - link
If available, would the feature be called DIPM/HIPM in our bios's; or is it likely to be obfuscated to something else?Also, why is it often disabled by default? Is there a penalty related to enabling it?
Kristian Vättö - Monday, October 29, 2012 - link
Here are instructions for enabling DIPM/HIPM:http://www.sevenforums.com/tutorials/177819-ahci-l...
In desktops it's not as important because you aren't running off of a battery and the power that SSDs/HDs use is so little anyway that it won't affect your power bill. I'm not sure why it's disabled, though, because I havent heard of any concrete issues caused by it.
Per Hansson - Monday, October 29, 2012 - link
Actually I'm not sure that DIPM/HIPM is the whole reason.I mentioned it previously and it for sure can have a dramatic difference.
But just as important is the measuring equipment used for the power consumption.
A cheap DMM only measures in very slow intervals, you would get very different results when measuring using a $100 Fluke vs a $1000 Fluke vs a Scope with really high bandwidth.
It's because the SSD changes power levels many hundred times per second and this is too fast for a regular DMM so you just get some of the data points, not enough to make a reliable averge...
MrSpadge - Monday, October 29, 2012 - link
Wouldn't the slower / cheaper DMM measure over longer intervals (that's why it's slow in the first place) and hence automatically average over some fluctuation?