Intel SSD 335 (240GB) Review
by Kristian Vättö on October 29, 2012 11:30 AM ESTRandom Read/Write Speed
The four corners of SSD performance are as follows: random read, random write, sequential read and sequential write speed. Random accesses are generally small in size, while sequential accesses tend to be larger and thus we have the four Iometer tests we use in all of our reviews.
Our first test writes 4KB in a completely random pattern over an 8GB space of the drive to simulate the sort of random access that you'd see on an OS drive (even this is more stressful than a normal desktop user would see). I perform three concurrent IOs and run the test for 3 minutes. The results reported are in average MB/s over the entire time. We use both standard pseudo randomly generated data for each write as well as fully random data to show you both the maximum and minimum performance offered by SandForce based drives in these tests. The average performance of SF drives will likely be somewhere in between the two values for each drive you see in the graphs. For an understanding of why this matters, read our original SandForce article.
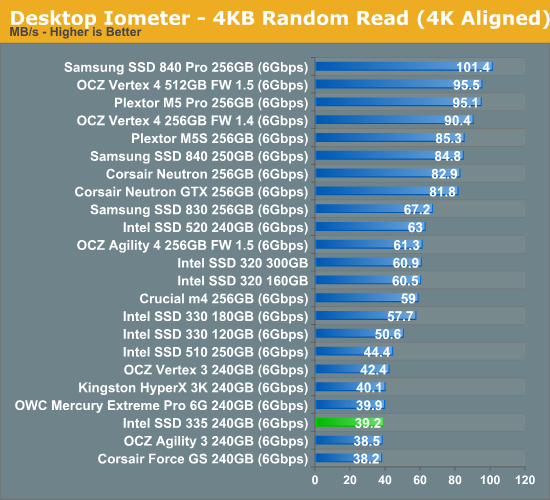
Random read performance has never been SandForce's biggest strength and even Intel couldn't massively improve it with its own firmware. The SSD 335 is in fact slower than the SSD 330 here.
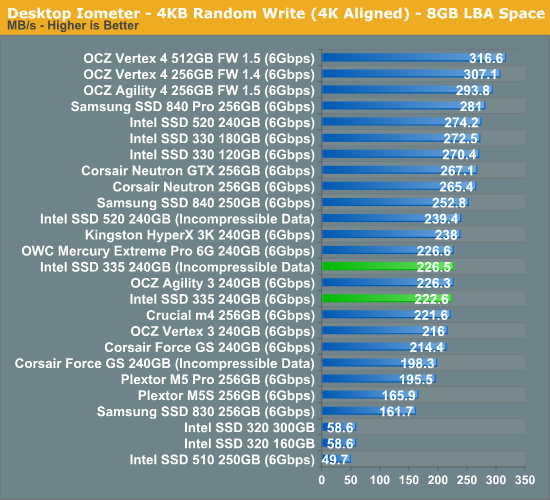
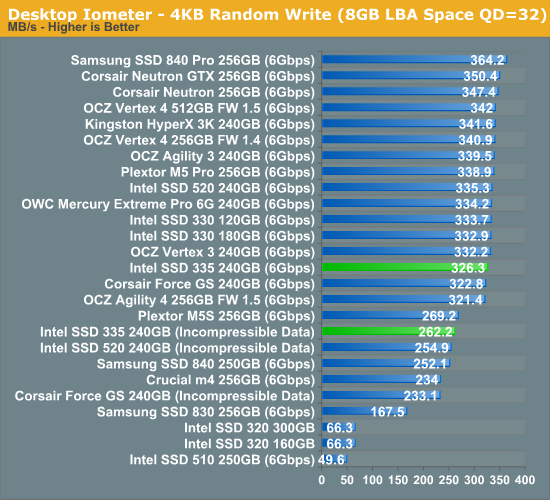
Random write speed at small queue depths is also slower compared to the 520 and 330, although at queue depth of 32 the difference is negligible.
Sequential Read/Write Speed
To measure sequential performance I ran a 1 minute long 128KB sequential test over the entire span of the drive at a queue depth of 1. The results reported are in average MB/s over the entire test length.
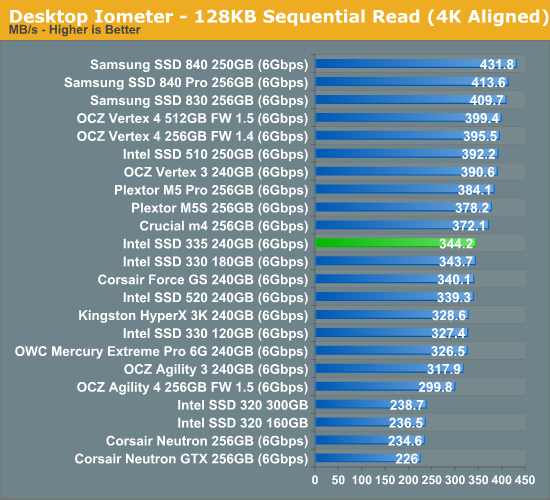
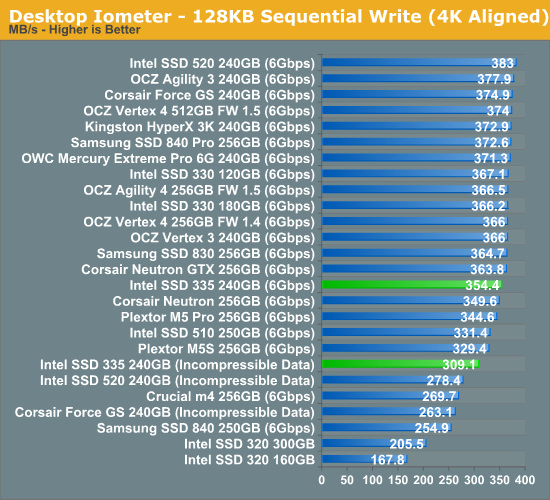
Sequential read performance is identical to SSD 330, but sequential write speed is slightly slower. What's notable is sequential write performance with incompressible data: the Intel SSD 335 manages to beat both the 520 and Corsair's Force GS by a noticeable margin.


69 Comments
View All Comments
MichaelD - Tuesday, October 30, 2012 - link
I agree! Take Corsair for example; they've got like a hundred (sic) different SKU's. "Force" "Subforce" "Battle" "Skeedaddle" and "Primo" versions of SSDs...marketing FUD at it's finest. Only the .5% of SSD buyers (like AT readers) will actually look at specs and decide. The other 99.5% will just buy whatever box has the "fastest looking" cover art.zanon - Monday, October 29, 2012 - link
Now they just get giggle-stomped across the board by Samsung. I hope Intel decides to be competitive again someday, but in the mean time it's hard to see any reason to bother.MadMan007 - Monday, October 29, 2012 - link
Read past the sythetics to real-world tests. It is at least competitive in most cases, and all these drives are stupid fast anyway.jeffbui - Monday, October 29, 2012 - link
Why is there such a discrepancy between the power consumption figures given by the manufacturer vs what you're getting from your testing? (Samsung mostly) Other websites are getting completely different power usage figures as well.DanNeely - Monday, October 29, 2012 - link
Comments on one of AT's other recent SSD articles claimed this is because the power consumption test is being done using an external enclosure that never lets the drive drop into it's lowest power states. I didn't see any official comment on it.Kristian Vättö - Monday, October 29, 2012 - link
Some manufacturers such as Samsung report their power numbers with DIPM/HIPM (Device/Host Initiated Link Power Management) enabled, which can lower the power consumption significantly. DIPM/HIPM are not enabled on desktop by default and I'm not sure if all laptops have them enabled either.We have ran tests with DIPM/HIPM enabled and gotten results similar to what manufacturers report, but so far we have kept on publishing numbers with DIPM/HIPM disabled. We will probably add DIPM/HIPM numbers once we redo our SSD testing methodology.
DanNeely - Monday, October 29, 2012 - link
If available, would the feature be called DIPM/HIPM in our bios's; or is it likely to be obfuscated to something else?Also, why is it often disabled by default? Is there a penalty related to enabling it?
Kristian Vättö - Monday, October 29, 2012 - link
Here are instructions for enabling DIPM/HIPM:http://www.sevenforums.com/tutorials/177819-ahci-l...
In desktops it's not as important because you aren't running off of a battery and the power that SSDs/HDs use is so little anyway that it won't affect your power bill. I'm not sure why it's disabled, though, because I havent heard of any concrete issues caused by it.
Per Hansson - Monday, October 29, 2012 - link
Actually I'm not sure that DIPM/HIPM is the whole reason.I mentioned it previously and it for sure can have a dramatic difference.
But just as important is the measuring equipment used for the power consumption.
A cheap DMM only measures in very slow intervals, you would get very different results when measuring using a $100 Fluke vs a $1000 Fluke vs a Scope with really high bandwidth.
It's because the SSD changes power levels many hundred times per second and this is too fast for a regular DMM so you just get some of the data points, not enough to make a reliable averge...
MrSpadge - Monday, October 29, 2012 - link
Wouldn't the slower / cheaper DMM measure over longer intervals (that's why it's slow in the first place) and hence automatically average over some fluctuation?