The AMD 2nd Gen Ryzen Deep Dive: The 2700X, 2700, 2600X, and 2600 Tested
by Ian Cutress on April 19, 2018 9:00 AM ESTPrecision Boost 2 and XFR2: Ensuring It Hertz More
One of the biggest changes for the new Ryzen-2000 series is in how the processor implements its turbo. Up until this point (except the recent APU launch), processors have relied on a step function implementation: the system determines how many threads are loaded, attempts to implement a specific frequency on those cores if possible, and then follows the look-up table relating thread count to frequency. AMD’s goal in Precision Boost 2 is to make this process more dynamic.
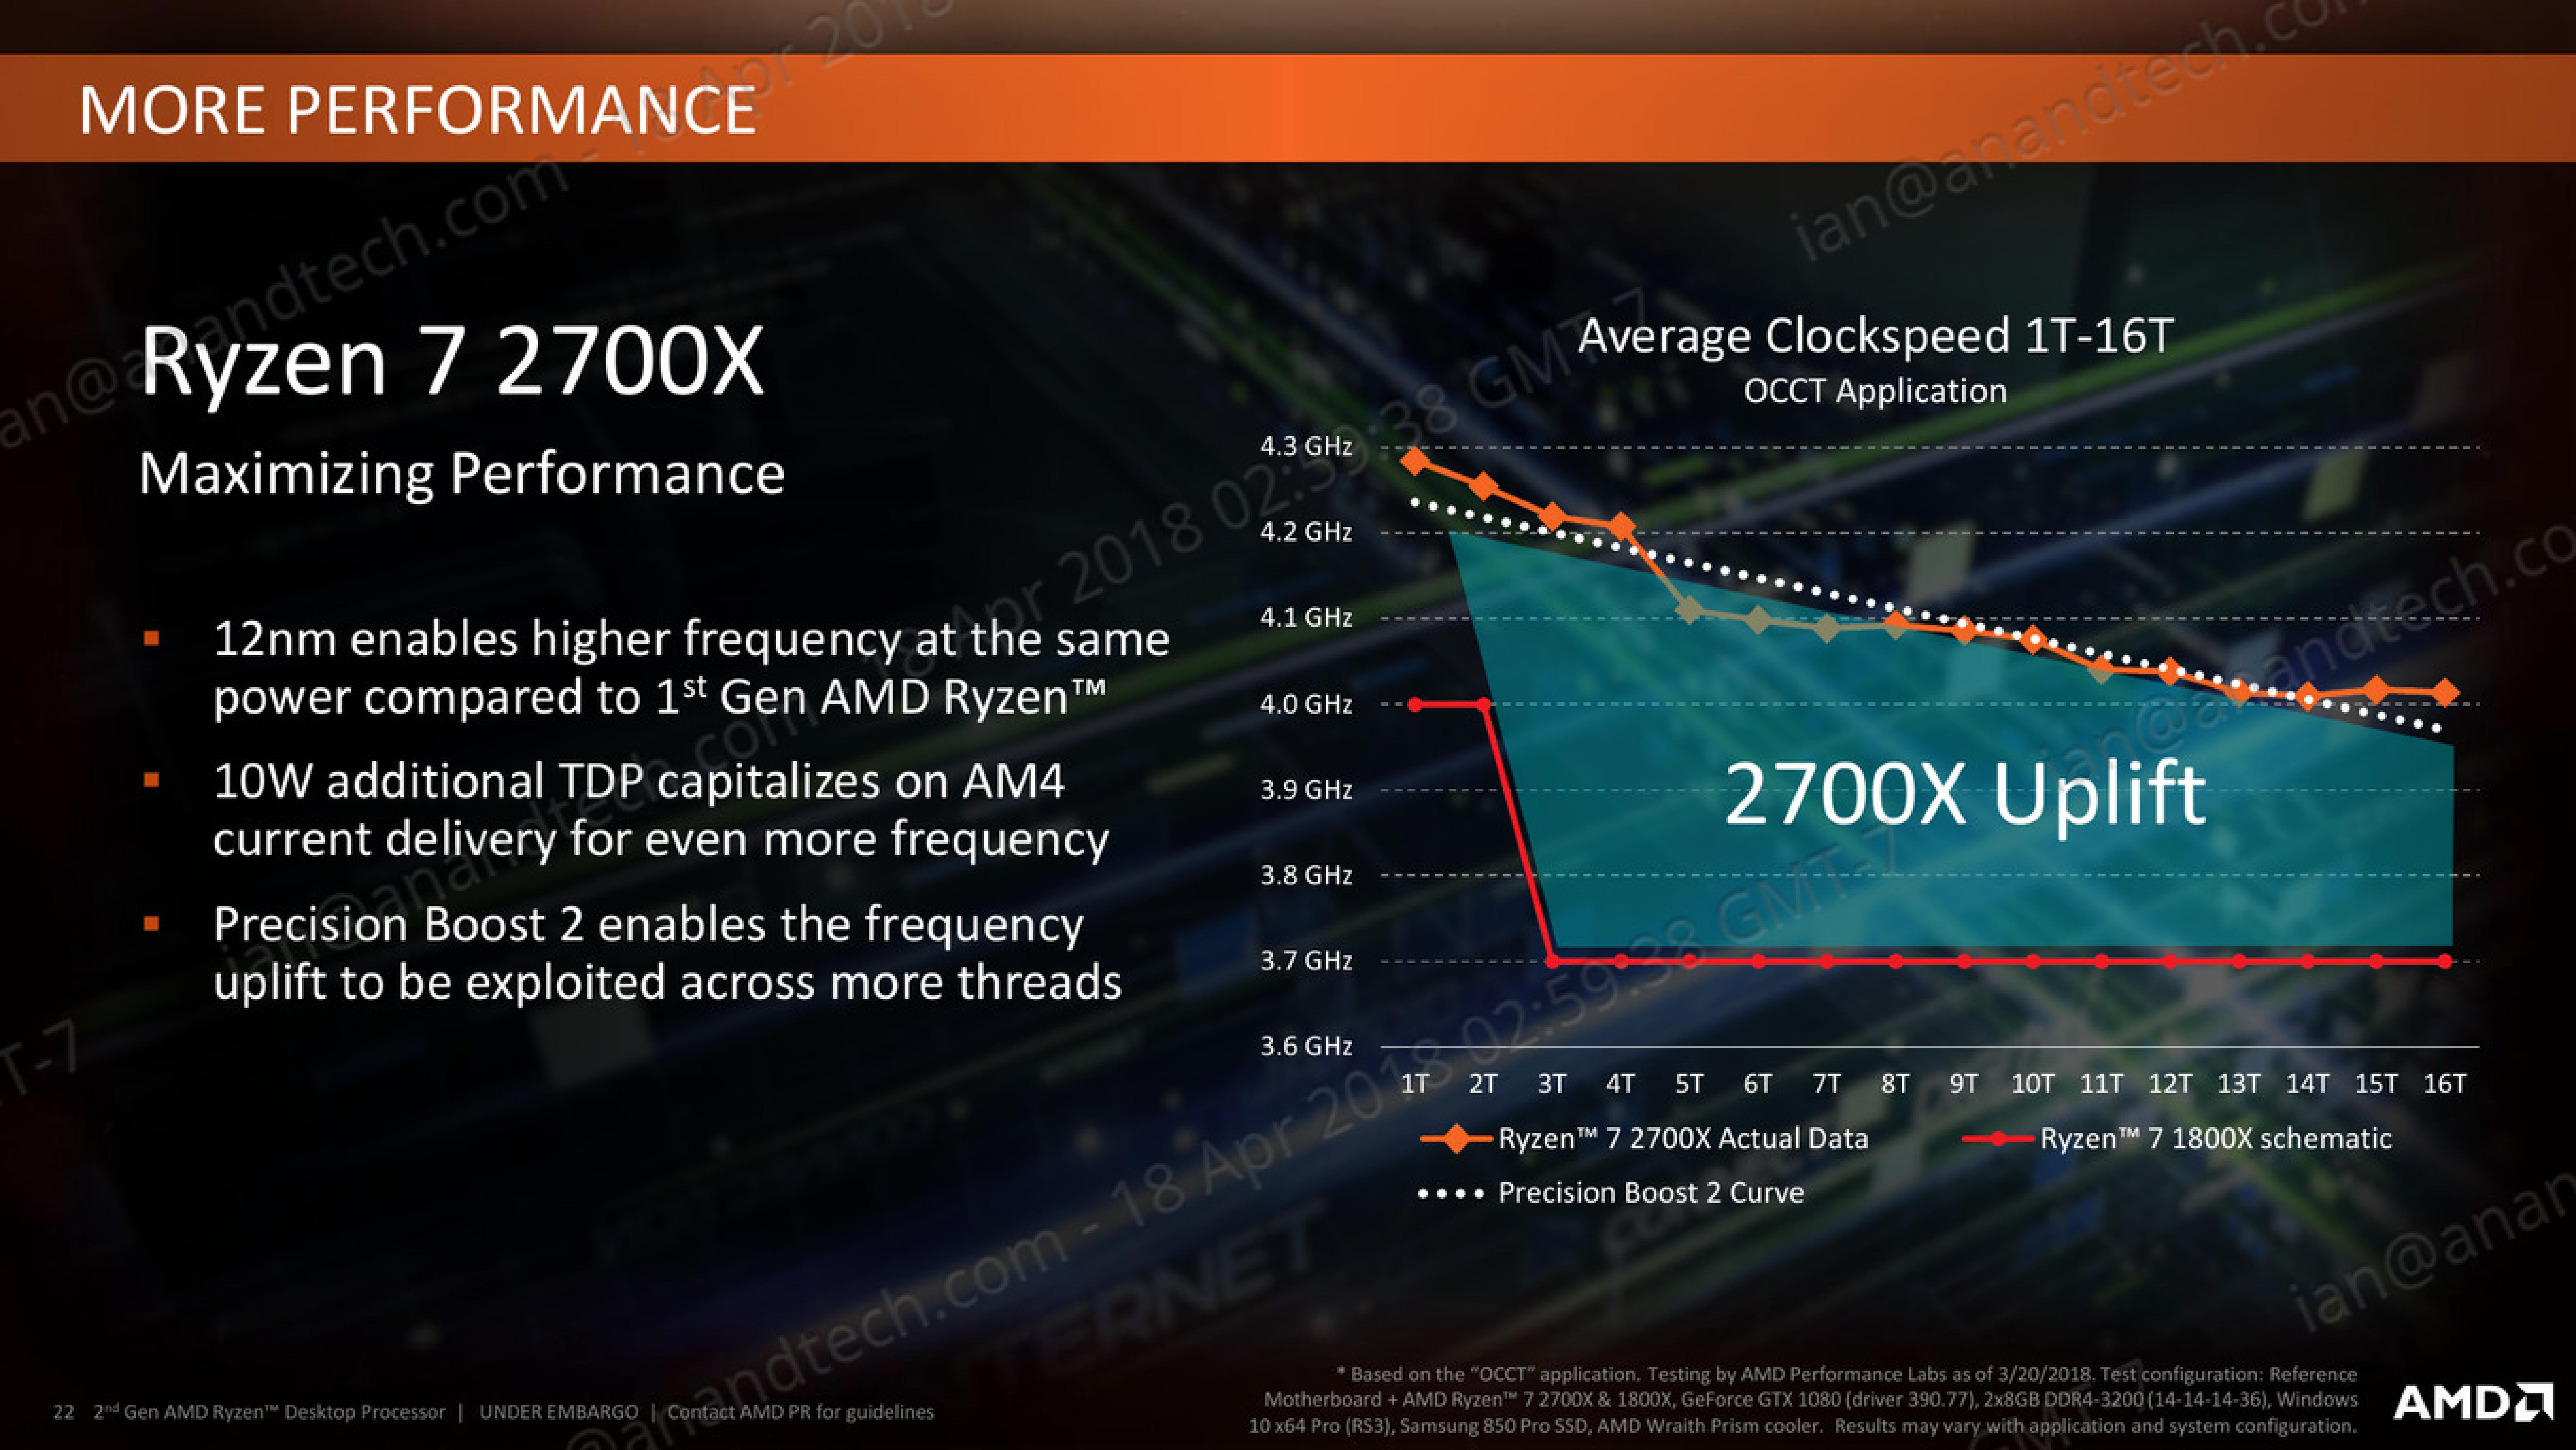
This image from AMD is how the feature is being represented: the system will determine how much of the power budget is still available, and turbo as much as possible until it hits one of the limiting factors. These factors can be any of, but not limited to, the following:
- Total chip peak power
- Individual core voltage/frequency response
- Thermal interactions between neighboring cores
- Power delivery limitations to individual cores/groups of cores
- Overall thermal performance
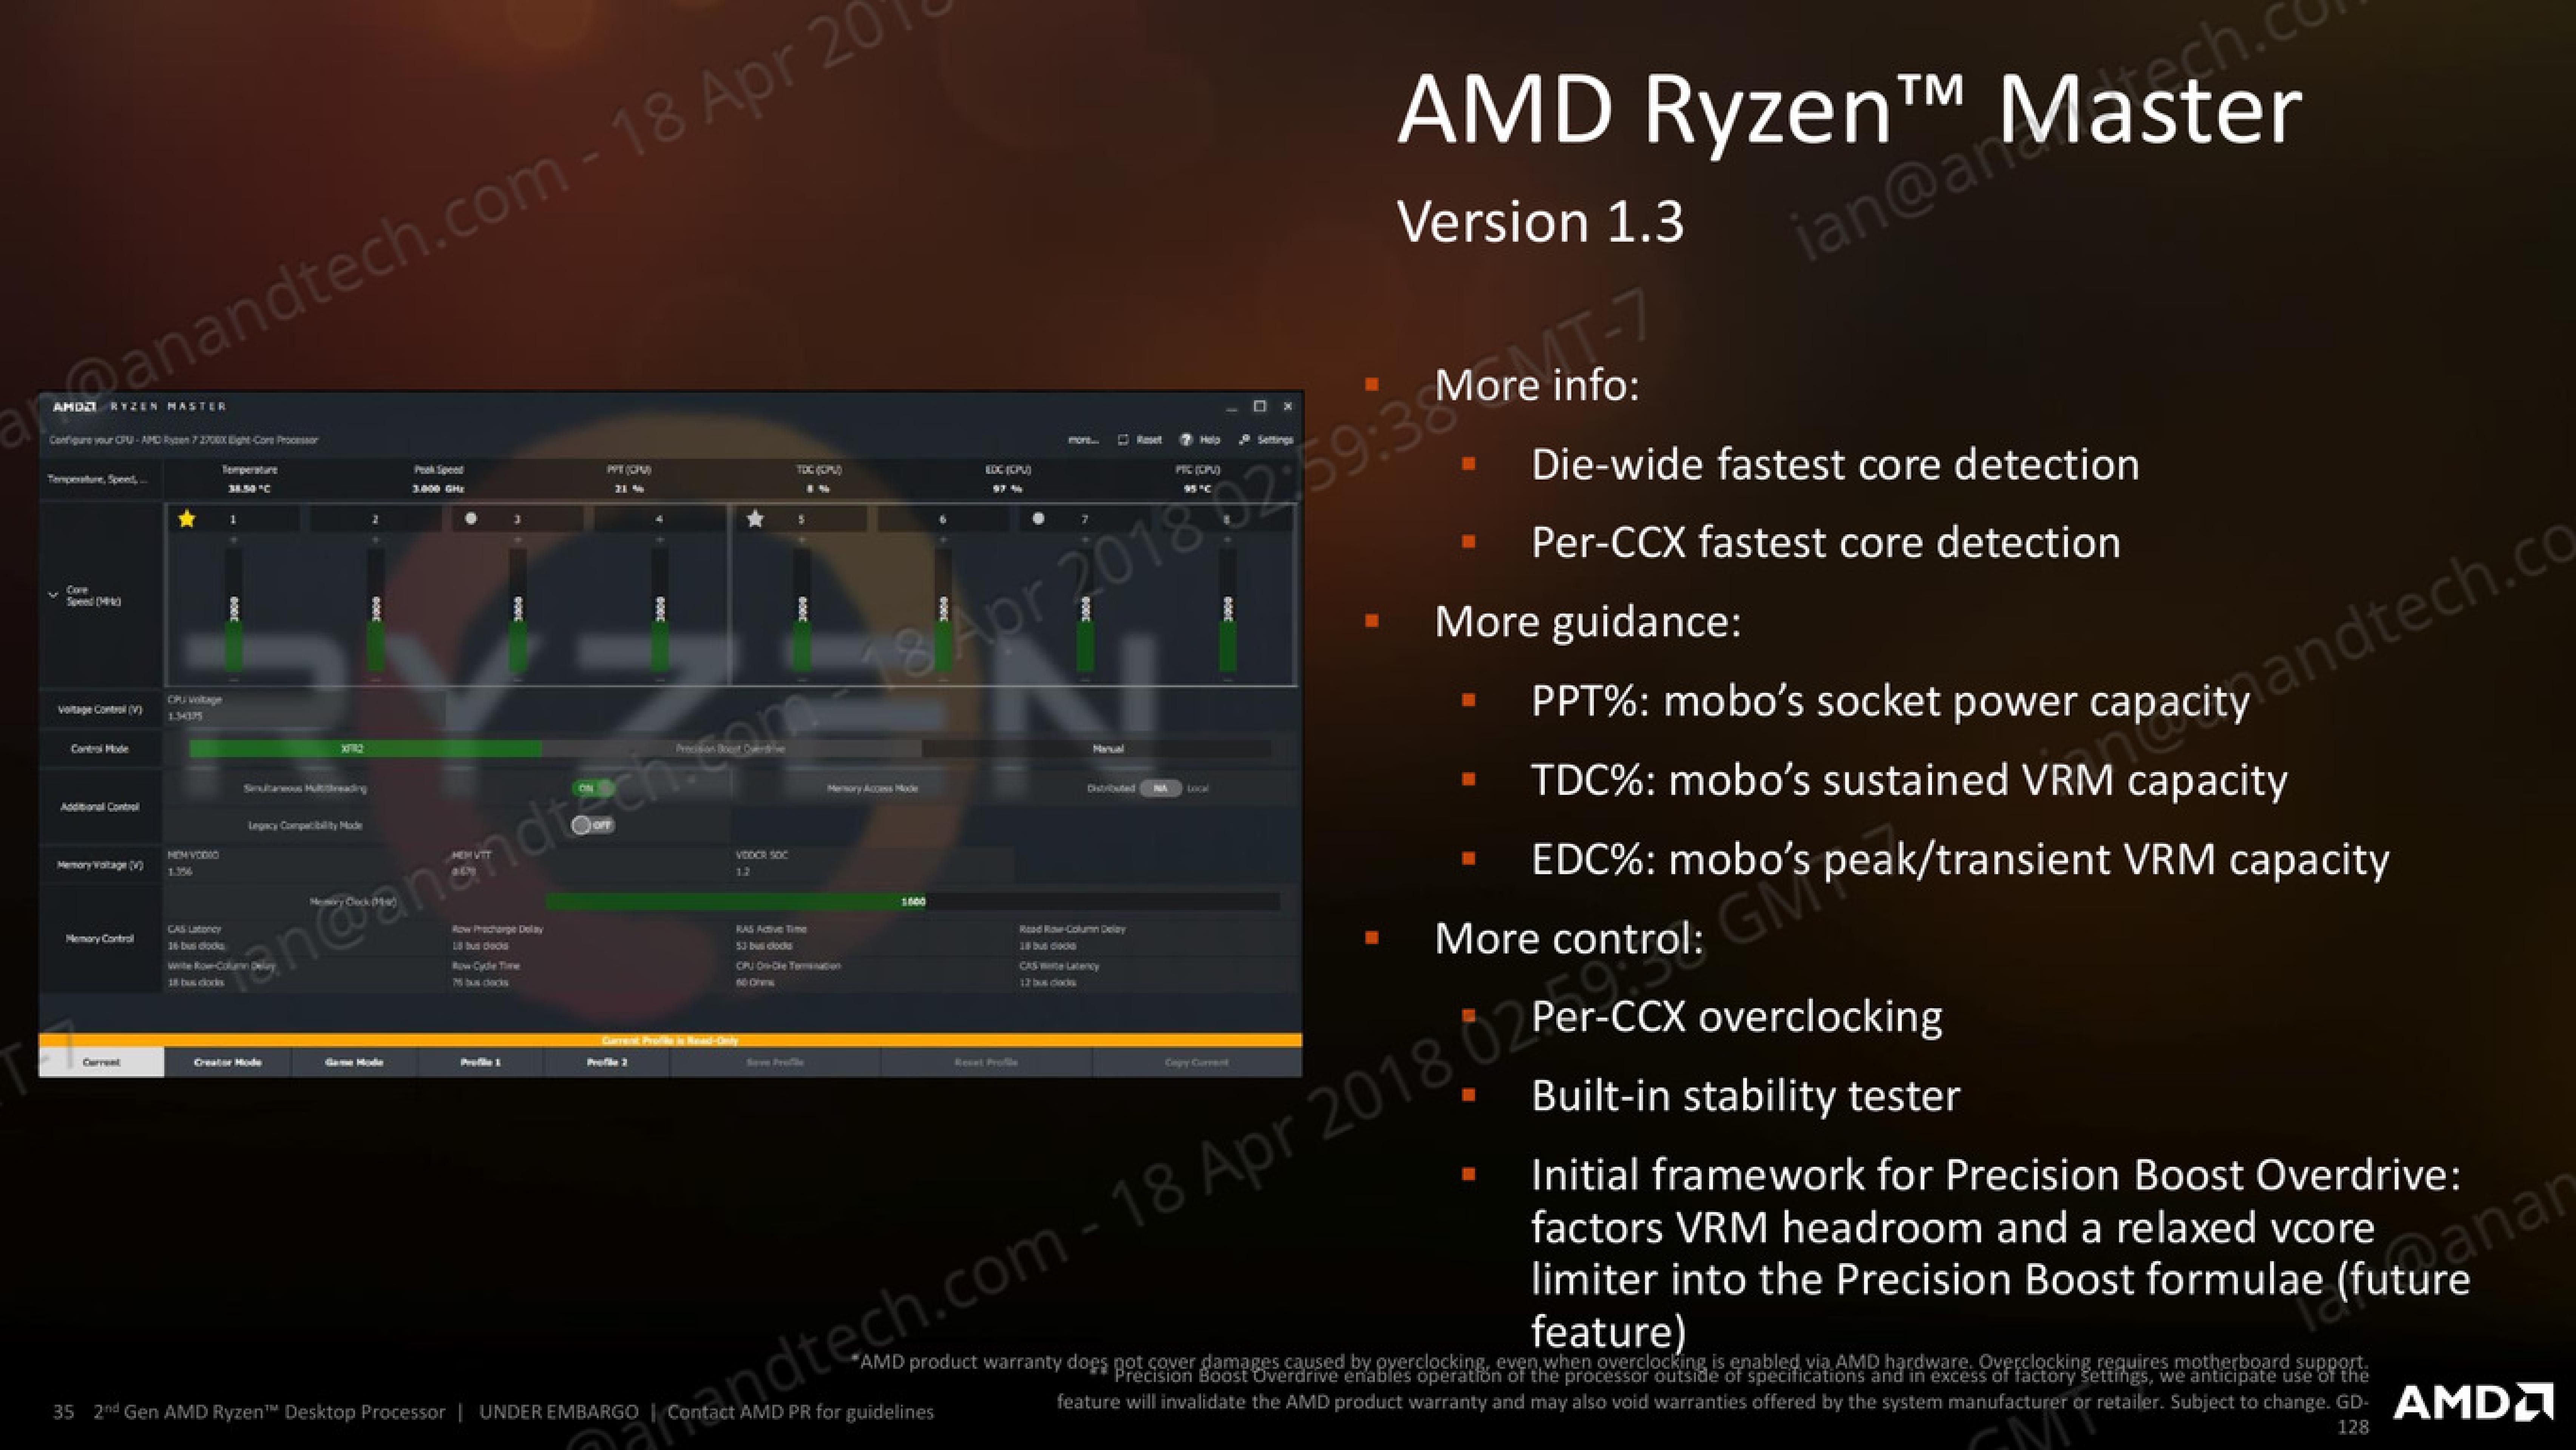
AMD’s new Ryzen Master 1.3 software, when used on a Ryzen 2000-series processor, has several indicators to determine what the limiting factors are. For the most part, the way the processor will boost and respond to the environment, will be transparent to the user.
The best way to test this in action, from my perspective, is to look at the power draw of the first generation and second generation Ryzen processors. We can examine the internal estimated power consumption of each core individually as thankfully AMD has left these registers exposed, to give the following data:
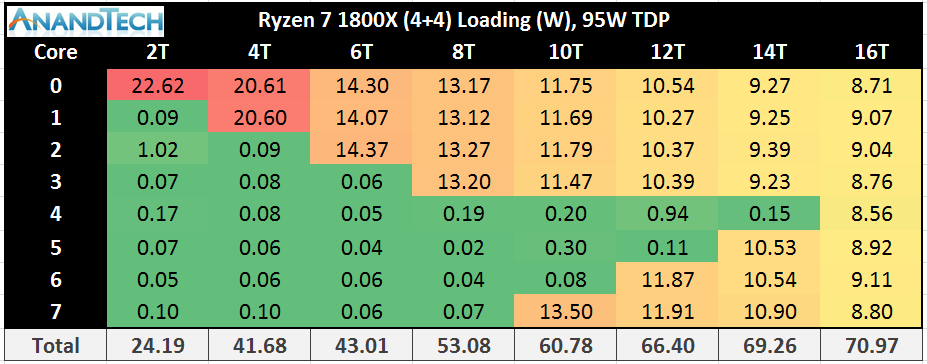
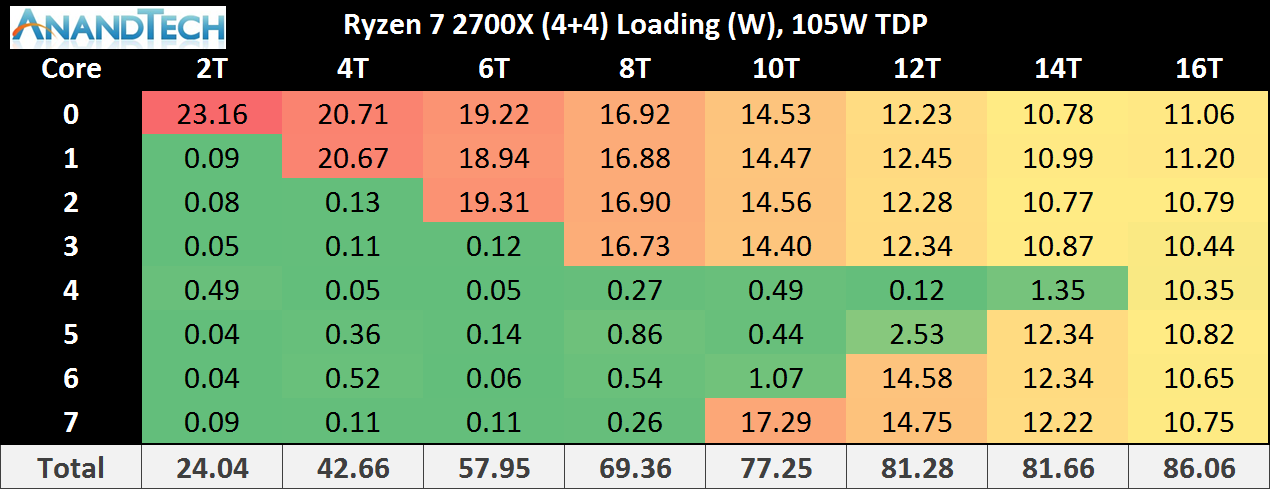
This is only the core consumption power, not the package power, which would include the DRAM controller, the Infinity Fabric, and the processor IO. This means we get numbers different to the rated TDP, but the danger here is that because the Ryzen 7 2700X has a 10W TDP higher than the Ryzen 7 1800X, where the 2700X draws more power it could seem as if that is the TDP response.
Just plotting the power consumption gives this graph:
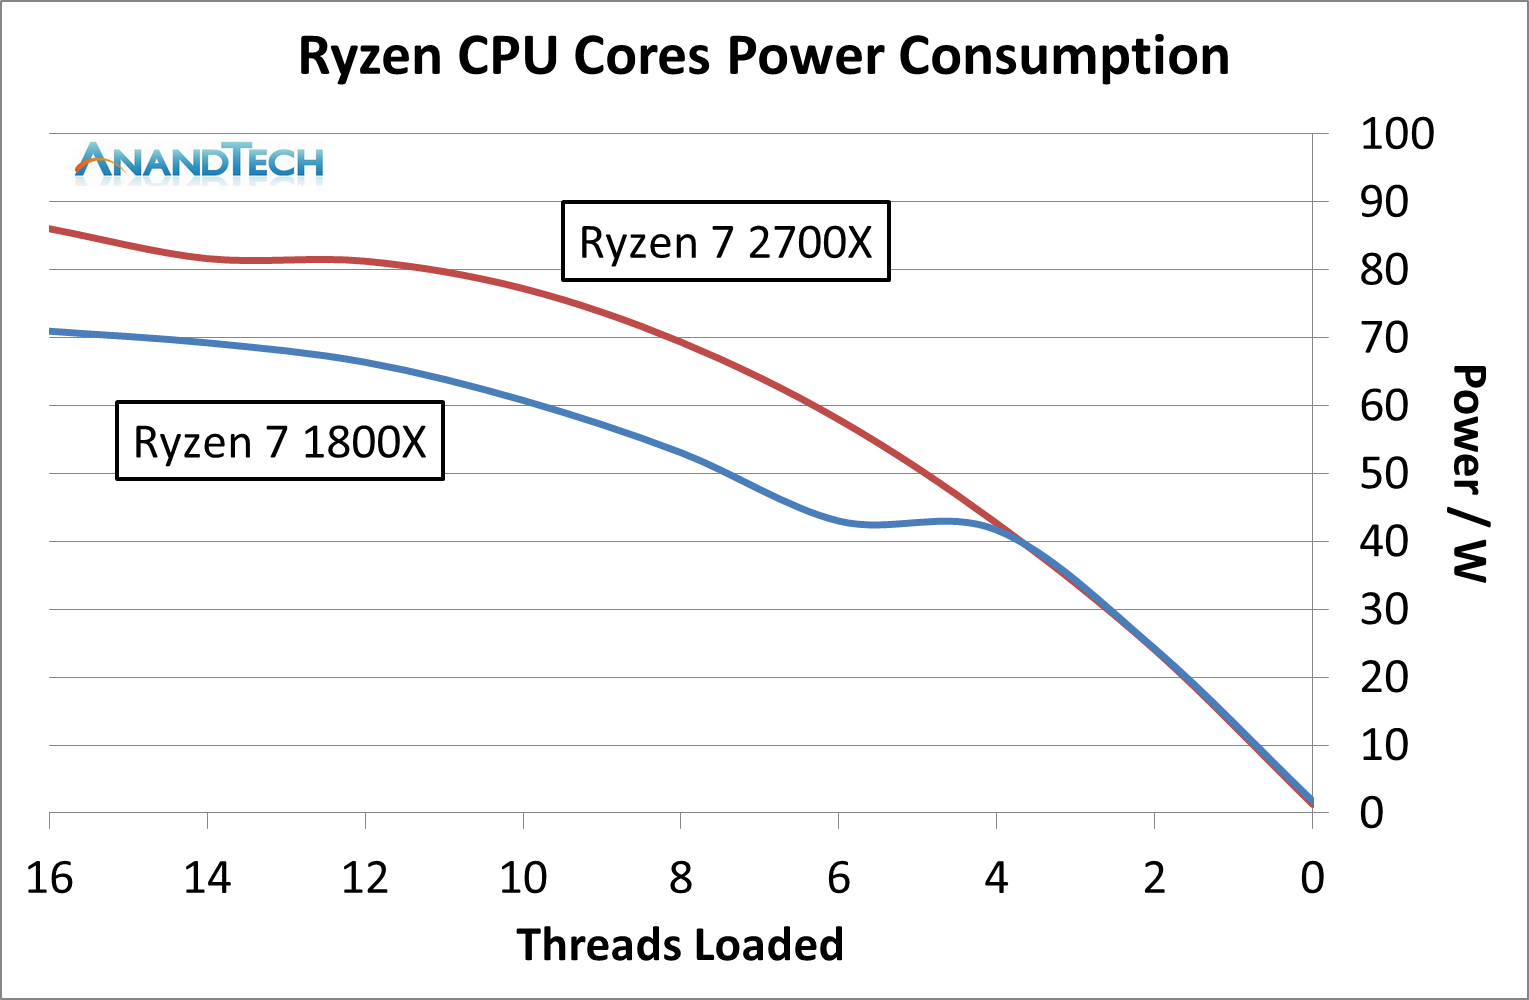
Even in this case it is clear that the Ryzen 7 2700X is drawing more power, up to 20W more, for a variable threaded load. If we change the graph to be a function of peak power:
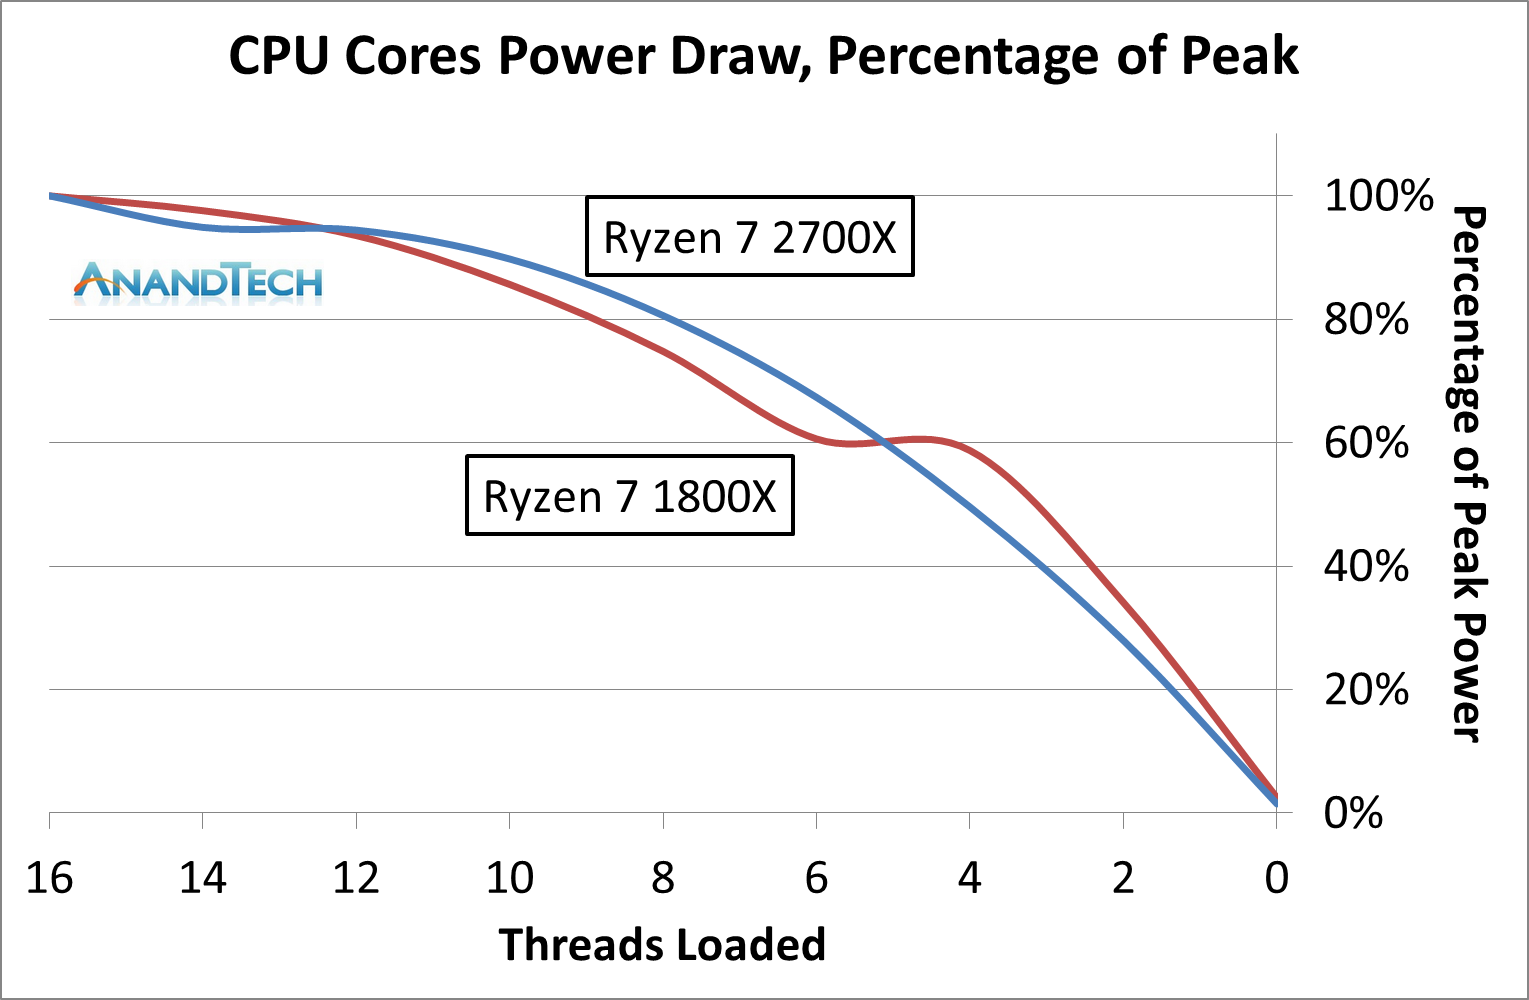
The results are not quite as clear: it would seem that the 1800X draws, as a percentage of peak power, more at low thread count, but the 2700X draws more at a middling thread count.
It is worth noting that the end result of Precision Boost 2 is two-fold: more performance, but also more power consumption. Users looking to place one of the lower powered processors into a small form factor system might look at disabling this feature and returning to a standard step-function response in order to keep the thermal capabilities in check.
A side note – despite the marketing name being called ‘Precision Boost 2’, the internal BIOS name is called ‘Core Performance Boost’. It sounds similar to Multi-Core Enhancement, which is a feature on some Intel motherboards designed to go above and beyond the turbo mechanism. However, this is just AMD’s standard PB2: disabling it will disable PB2. Initially we turned it off, thinking it was a motherboard manufacturer tool, only to throw away some testing because there is this odd disconnect between AMD’s engineers and AMD’s marketing.
Extended Frequency Range 2 (XFR2)
For the Ryzen 2000-series, AMD has changed what XFR does. In the previous generation it was applied on certain processors to allow them to boost above the maximum turbo frequency when the thermal situation was conducive to higher frequencies and higher voltage in low thread-count states. For this generation, it still relates to thermals, however the definition is applied to any core loading: if the CPU is under 60ºC, the processor can boost no matter what the loading is above its Precision Boost 2 frequency (so why not get a better PB2 implementation?). The core still has to be within a suitable voltage/frequency window to retain stability, however.
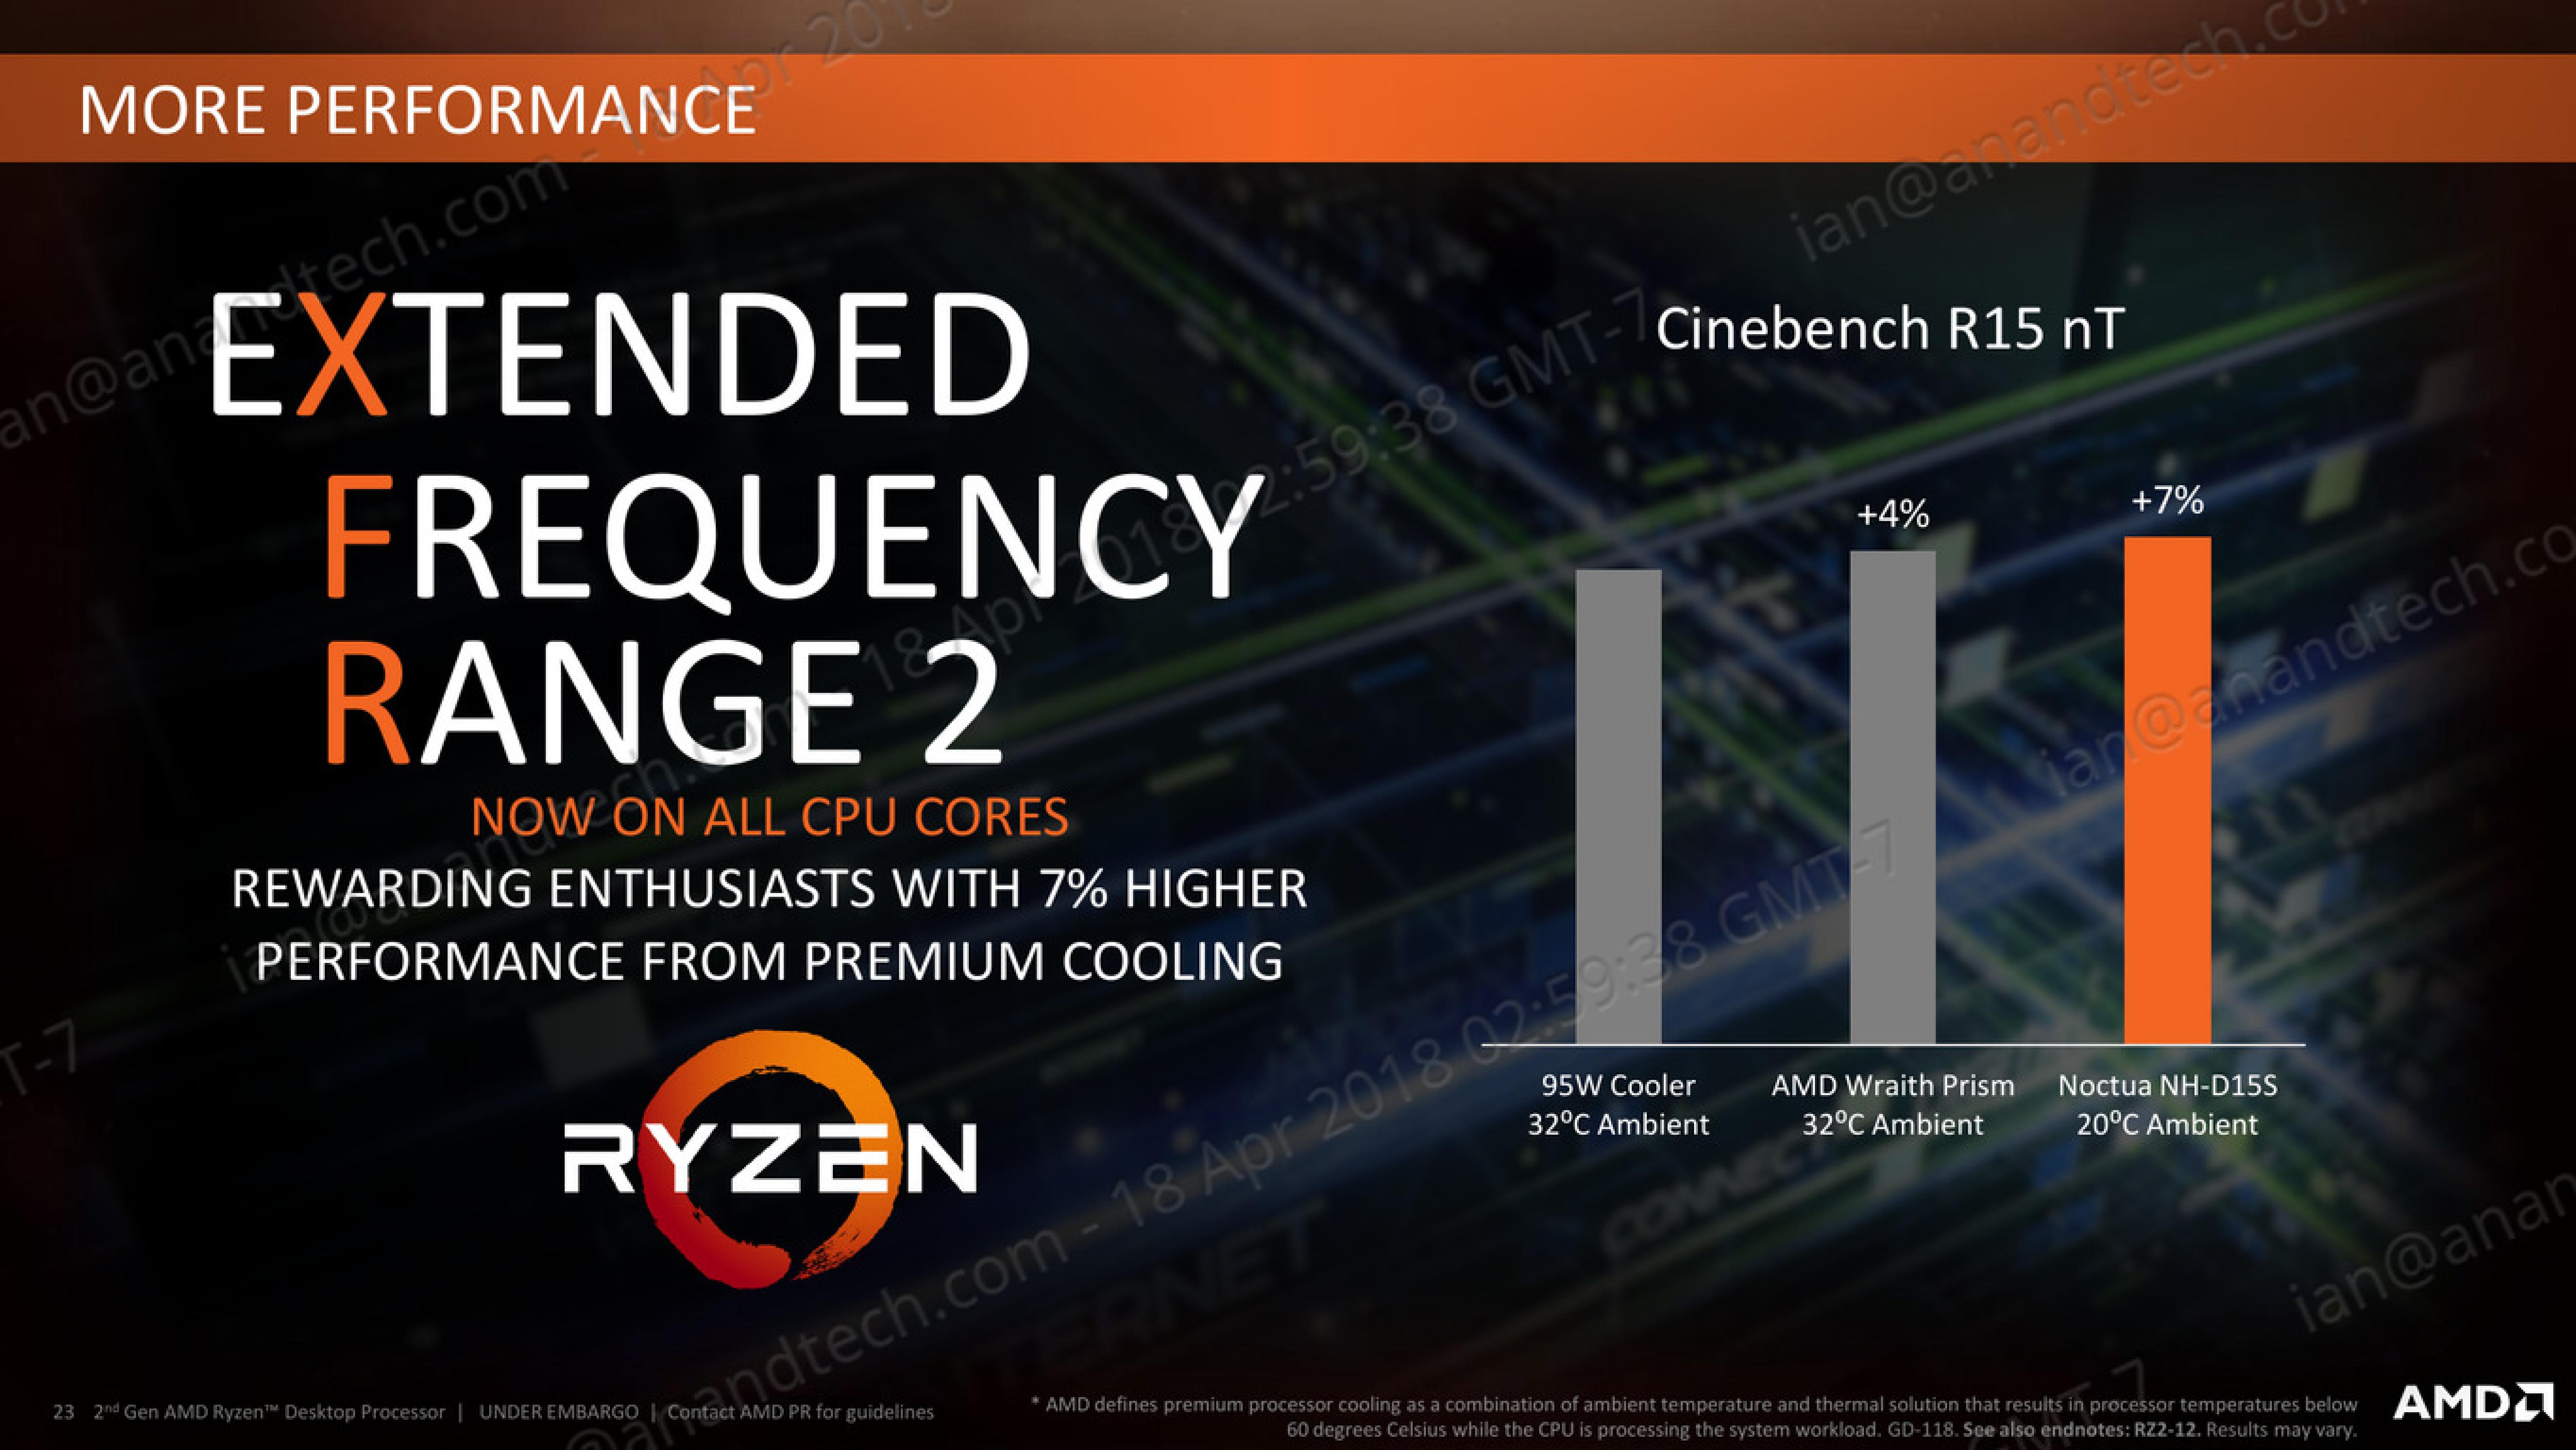
On certain motherboards, like the ASUS Crosshair VII Hero, there are additional options to assist XFR2 beyond AMD’s implementation. ASUS does not go into specific details, however I suspect it implements a more aggressive version, perhaps extending the voltage/frequency curve, raising the power limits, and/or adjusting the thermal limit.


545 Comments
View All Comments
bsp2020 - Thursday, April 19, 2018 - link
Was AMD's recently announced Spectre mitigation used in the testing? I'm sorry if it was mentioned in the article. Too long and still in the process of reading.I'm a big fan of AMD but want to make sure the comparison is apples to apples. BTW, does anyone have link to performance impact analysis of AMD's Spectre mitigation?
fallaha56 - Thursday, April 19, 2018 - link
Yep, X470 is microcode parchedThis article as it stands is Intel Fanboi stuff
fallaha56 - Thursday, April 19, 2018 - link
As in the Toms articleSaturnusDK - Thursday, April 19, 2018 - link
Maybe he didn't notice that the tests are at stock speeds?DCide - Friday, April 20, 2018 - link
I can't find any other site using a BIOS as recent as the 0508 version you used (on the ASUS Crosshair VII Hero). Most sites are using older versions. These days, BIOS updates surrounding processor launches make significant performance differences. We've seen this with every Intel and AMD CPU launch since the original Ryzen.Shaheen Misra - Sunday, April 22, 2018 - link
Hi , im looking to gain some insight into your testing methods. Could you please explain why you test at such high graphics settings? Im sure you have previously stated the reasons but i am not familiar with them. My understanding has always been that this creates a graphics bottleneck?Targon - Monday, April 23, 2018 - link
When you consider that people want to see benchmark results how THEY would play the games or do work, it makes sense to focus on that sort of thing. Who plays at a 720p resolution? Yes, it may show CPU performance, or eliminate the GPU being the limiting factor, but if you have a Geforce 1080 GTX, 1080p, 1440, and then 4k performance is what people will actually game at.The ability to actually run video cards at or near their ability is also important, which can be a platform issue. If you see every CPU showing the same numbers with the same video card, then yea, it makes sense to go for the lower settings/resolutions, but since there ARE differences between the processors, running these tests the way they are makes more sense from a "these are similar to what people will see in the real world" perspective.
FlashYoshi - Thursday, April 19, 2018 - link
Intel CPUs were tested with Meltdown/Spectre patches, that's probably the discrepancy you're seeing.MuhOo - Thursday, April 19, 2018 - link
Computerbase and pcgameshardware also used the patched... every other site has completely different results from anandtechsor - Thursday, April 19, 2018 - link
Fwiw I took five minutes to see what you guys are talking about. To me it looks like Toms is screwed up. If you look at the time graphs it looks to me like it’s the purple line on top most of the time, but the summaries have that CPU in 3rd or 4th place. E.G. https://img.purch.com/r/711x457/aHR0cDovL21lZGlhLm...At any rate things are generally damn close, and they largely aren’t even benchmarking the same games, so I don’t understand why a few people are complaining.