The AMD 2nd Gen Ryzen Deep Dive: The 2700X, 2700, 2600X, and 2600 Tested
by Ian Cutress on April 19, 2018 9:00 AM ESTPrecision Boost 2 and XFR2: Ensuring It Hertz More
One of the biggest changes for the new Ryzen-2000 series is in how the processor implements its turbo. Up until this point (except the recent APU launch), processors have relied on a step function implementation: the system determines how many threads are loaded, attempts to implement a specific frequency on those cores if possible, and then follows the look-up table relating thread count to frequency. AMD’s goal in Precision Boost 2 is to make this process more dynamic.
This image from AMD is how the feature is being represented: the system will determine how much of the power budget is still available, and turbo as much as possible until it hits one of the limiting factors. These factors can be any of, but not limited to, the following:
- Total chip peak power
- Individual core voltage/frequency response
- Thermal interactions between neighboring cores
- Power delivery limitations to individual cores/groups of cores
- Overall thermal performance
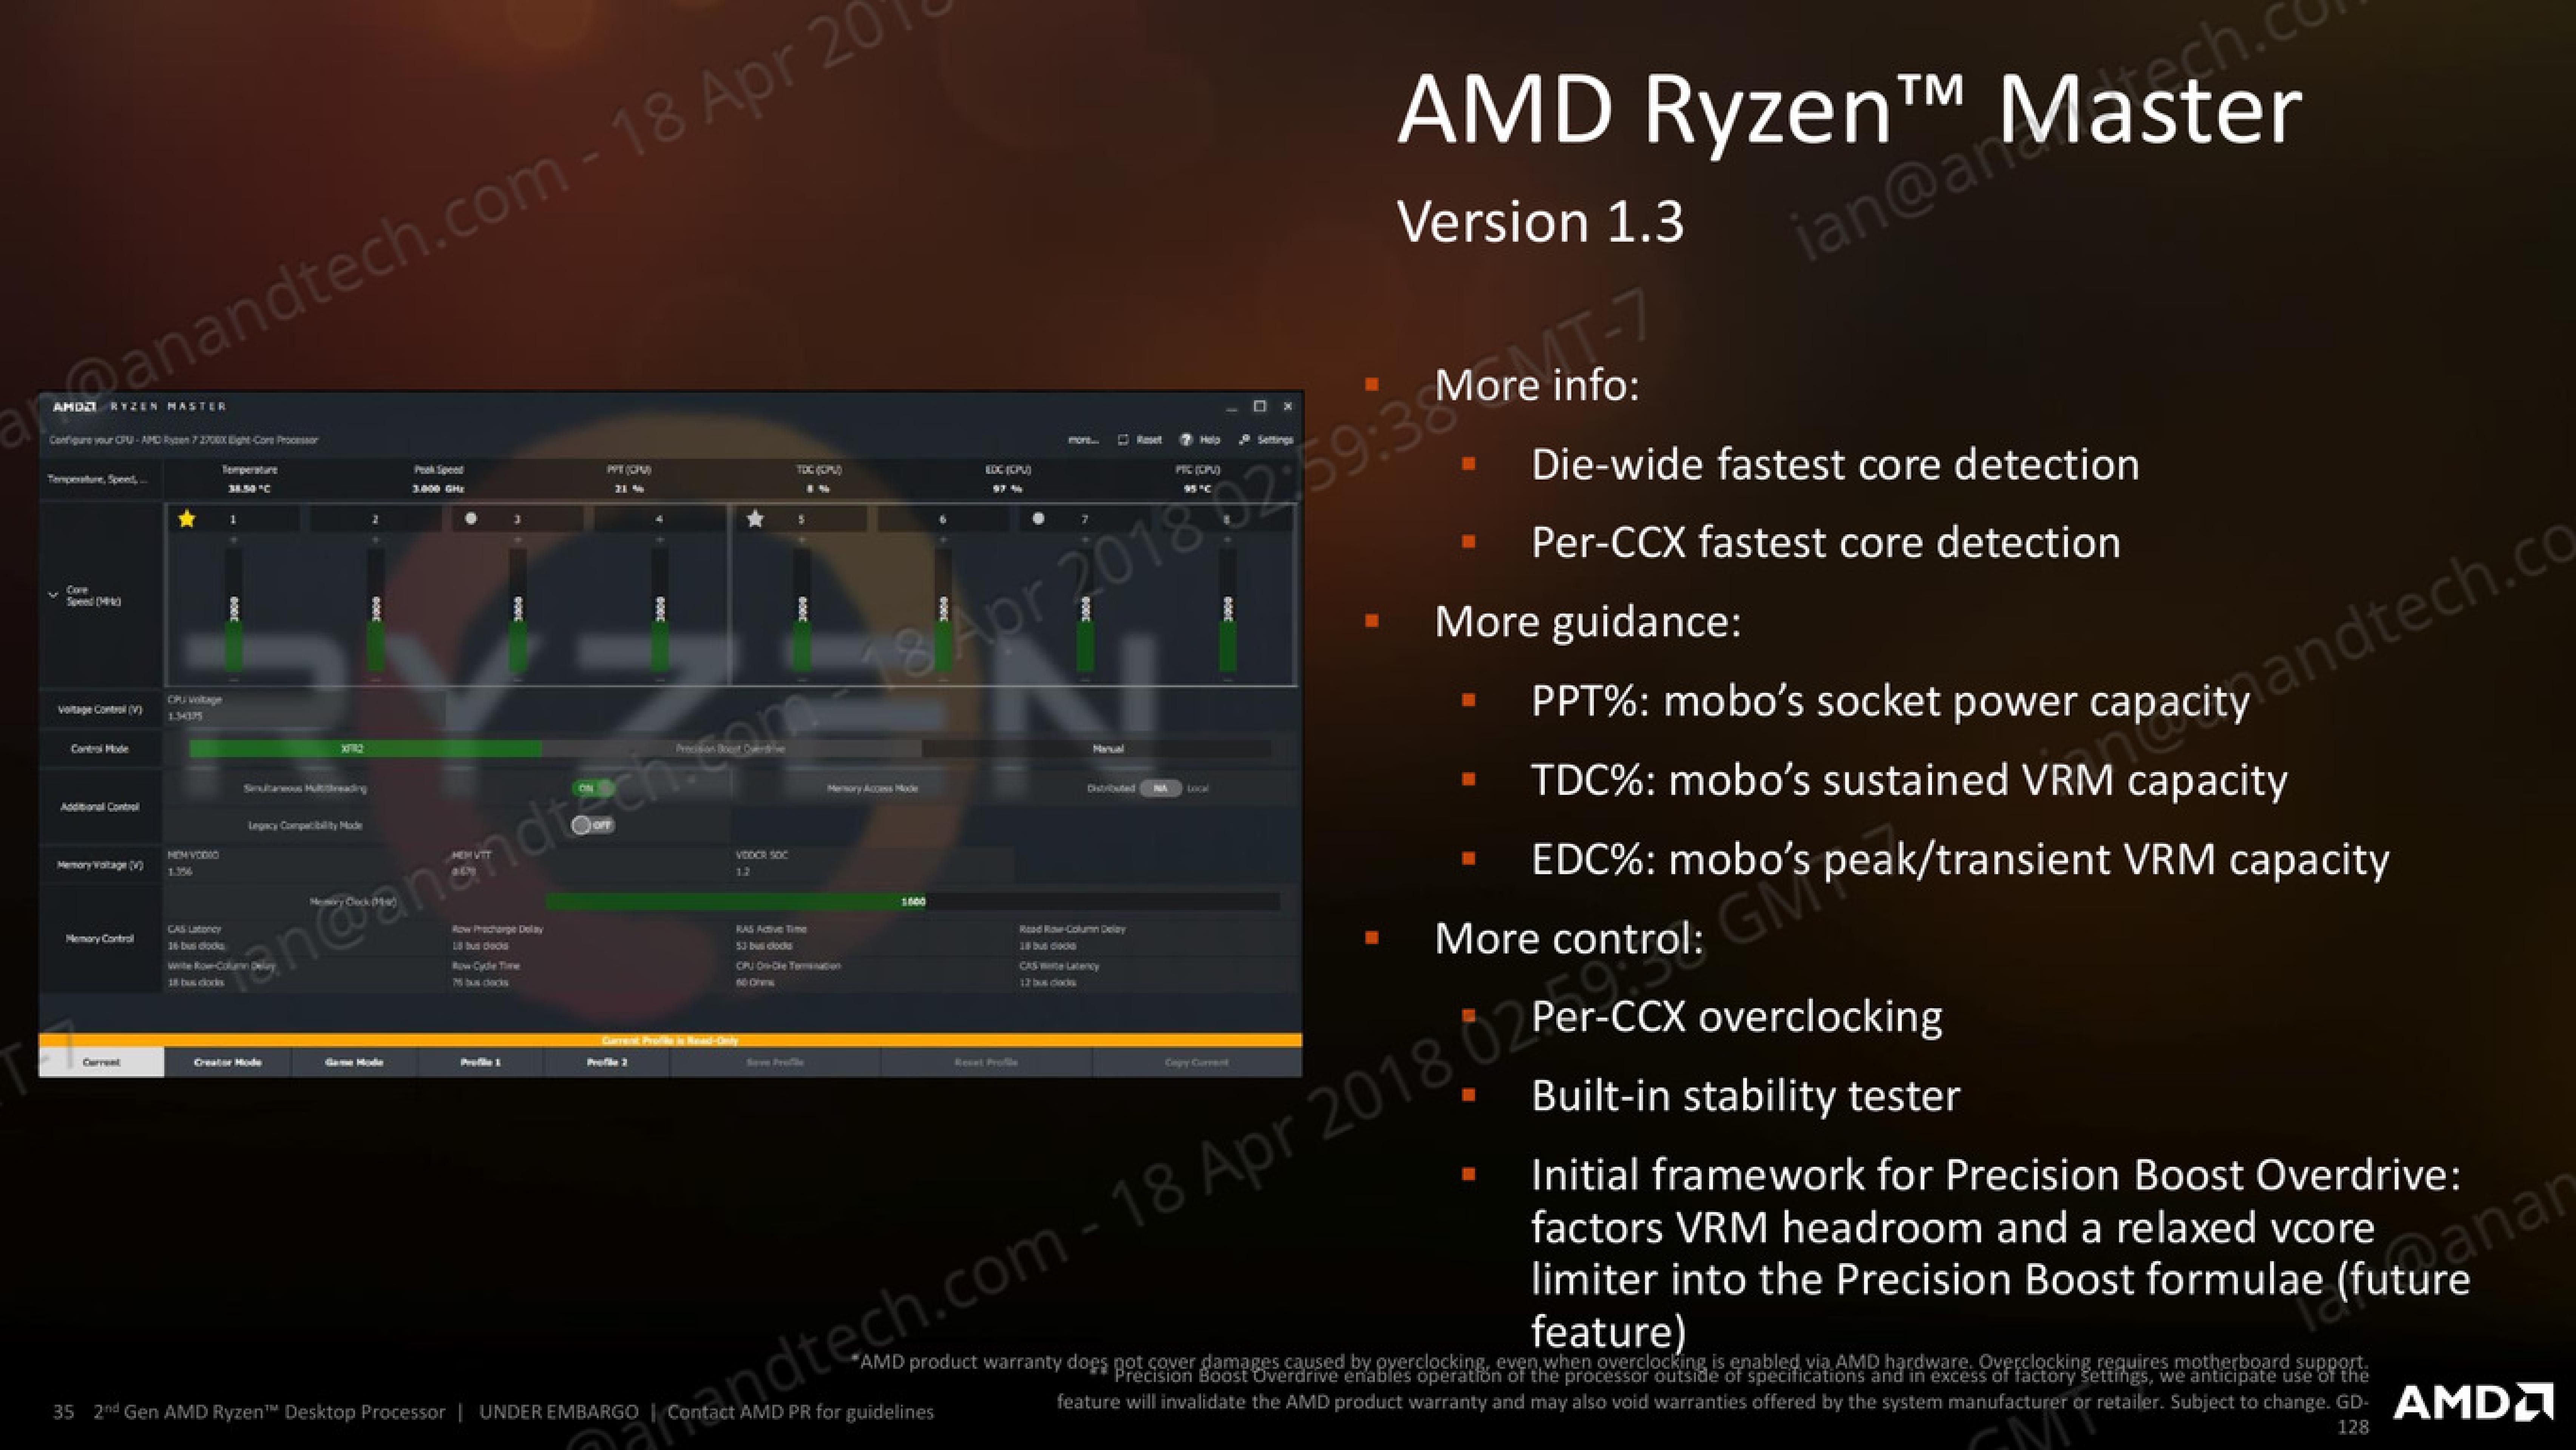
AMD’s new Ryzen Master 1.3 software, when used on a Ryzen 2000-series processor, has several indicators to determine what the limiting factors are. For the most part, the way the processor will boost and respond to the environment, will be transparent to the user.
The best way to test this in action, from my perspective, is to look at the power draw of the first generation and second generation Ryzen processors. We can examine the internal estimated power consumption of each core individually as thankfully AMD has left these registers exposed, to give the following data:
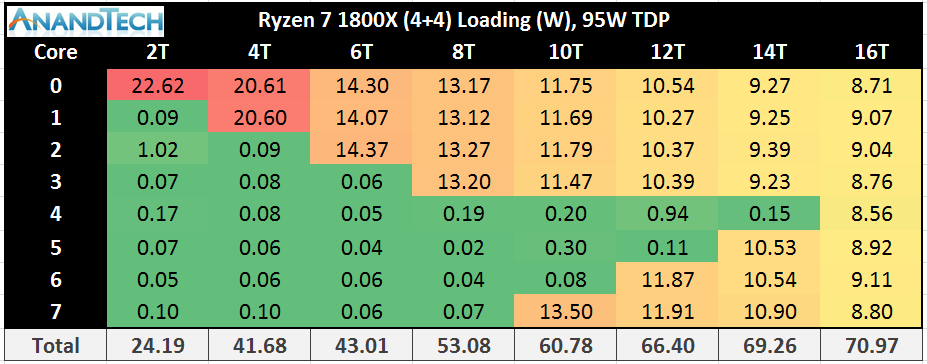
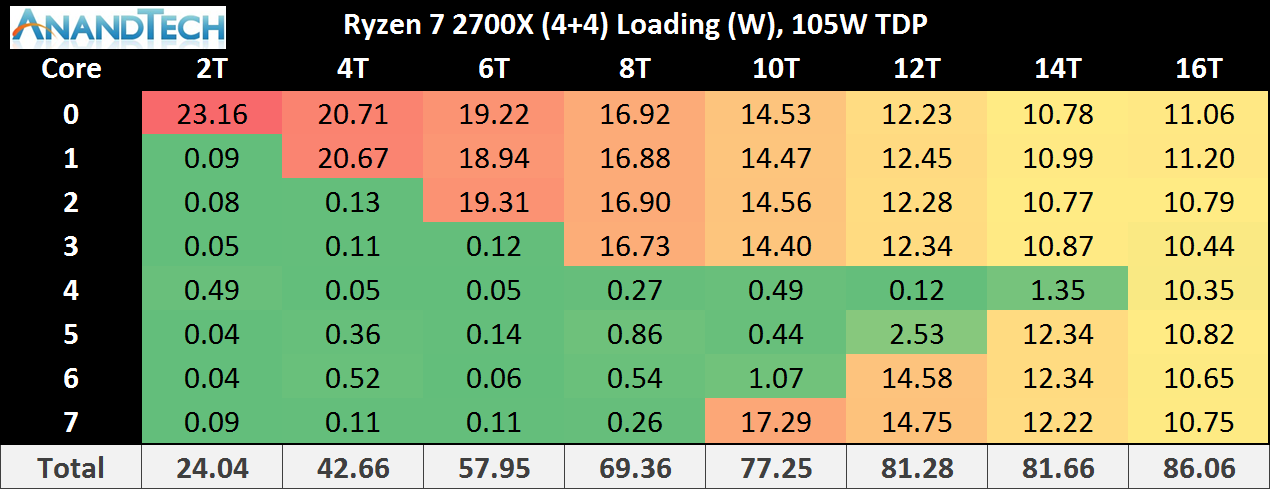
This is only the core consumption power, not the package power, which would include the DRAM controller, the Infinity Fabric, and the processor IO. This means we get numbers different to the rated TDP, but the danger here is that because the Ryzen 7 2700X has a 10W TDP higher than the Ryzen 7 1800X, where the 2700X draws more power it could seem as if that is the TDP response.
Just plotting the power consumption gives this graph:
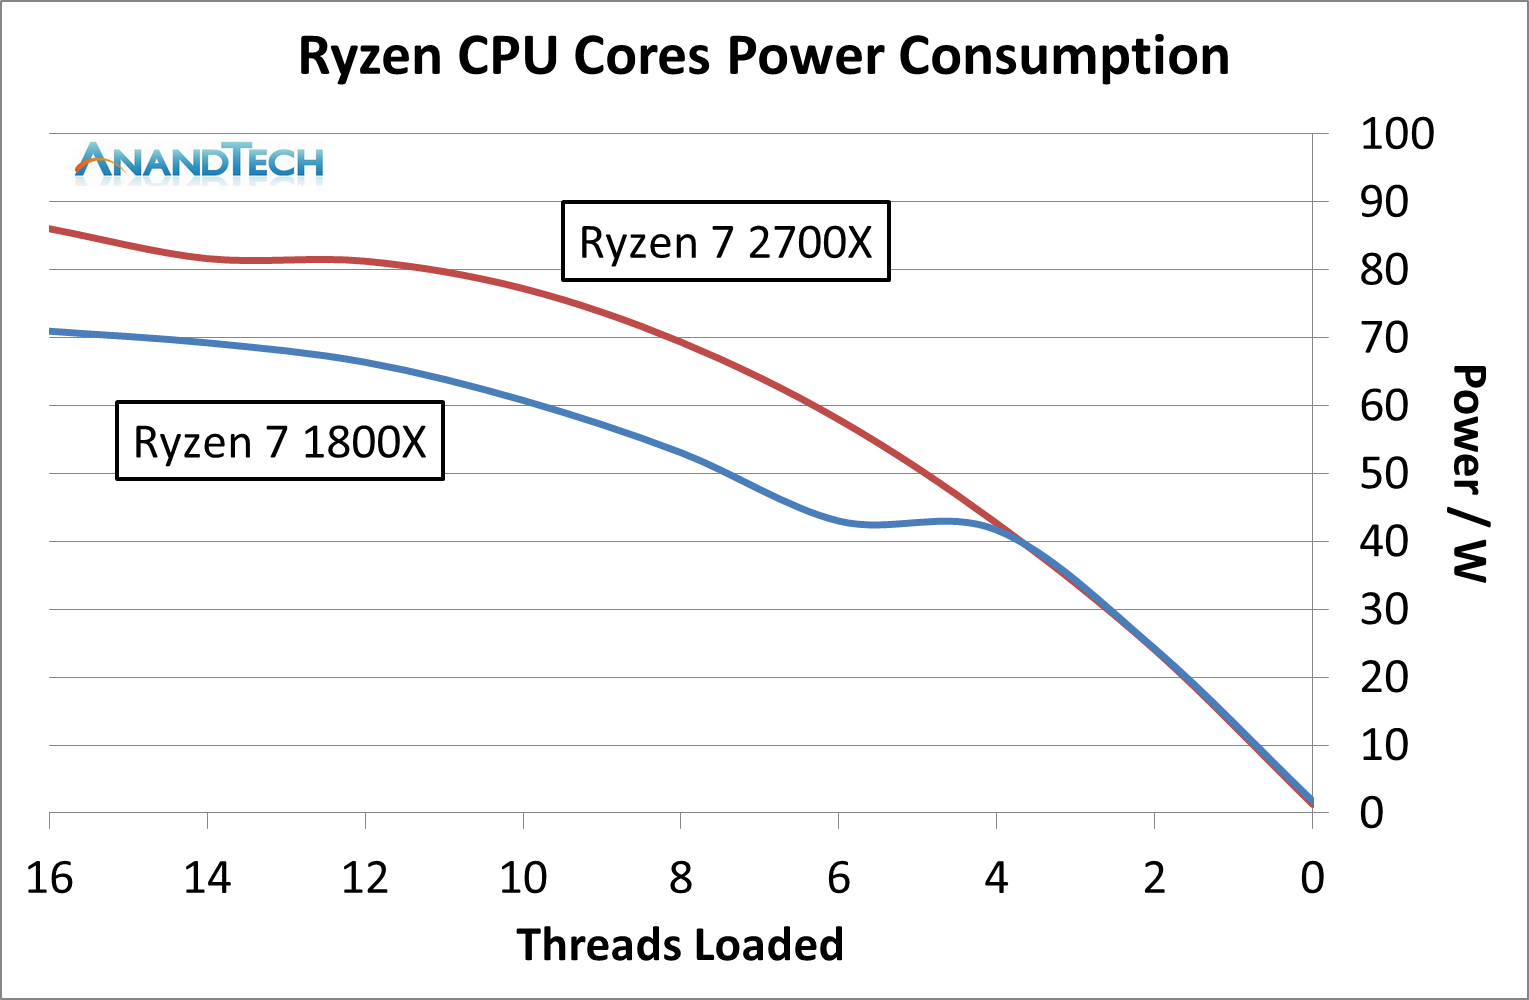
Even in this case it is clear that the Ryzen 7 2700X is drawing more power, up to 20W more, for a variable threaded load. If we change the graph to be a function of peak power:
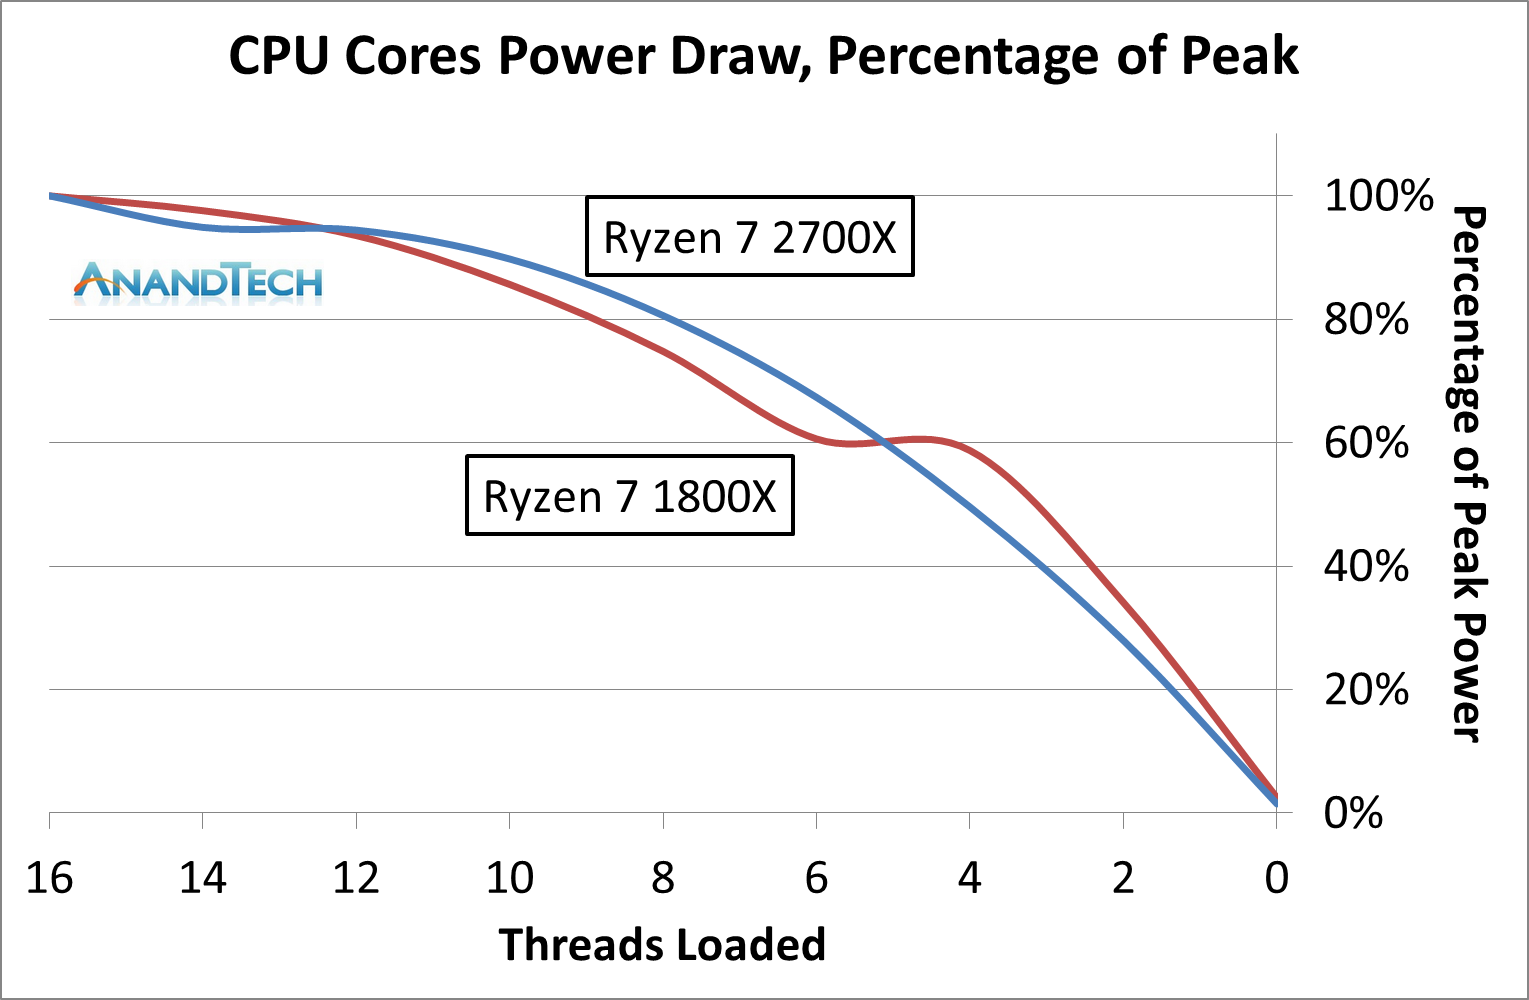
The results are not quite as clear: it would seem that the 1800X draws, as a percentage of peak power, more at low thread count, but the 2700X draws more at a middling thread count.
It is worth noting that the end result of Precision Boost 2 is two-fold: more performance, but also more power consumption. Users looking to place one of the lower powered processors into a small form factor system might look at disabling this feature and returning to a standard step-function response in order to keep the thermal capabilities in check.
A side note – despite the marketing name being called ‘Precision Boost 2’, the internal BIOS name is called ‘Core Performance Boost’. It sounds similar to Multi-Core Enhancement, which is a feature on some Intel motherboards designed to go above and beyond the turbo mechanism. However, this is just AMD’s standard PB2: disabling it will disable PB2. Initially we turned it off, thinking it was a motherboard manufacturer tool, only to throw away some testing because there is this odd disconnect between AMD’s engineers and AMD’s marketing.
Extended Frequency Range 2 (XFR2)
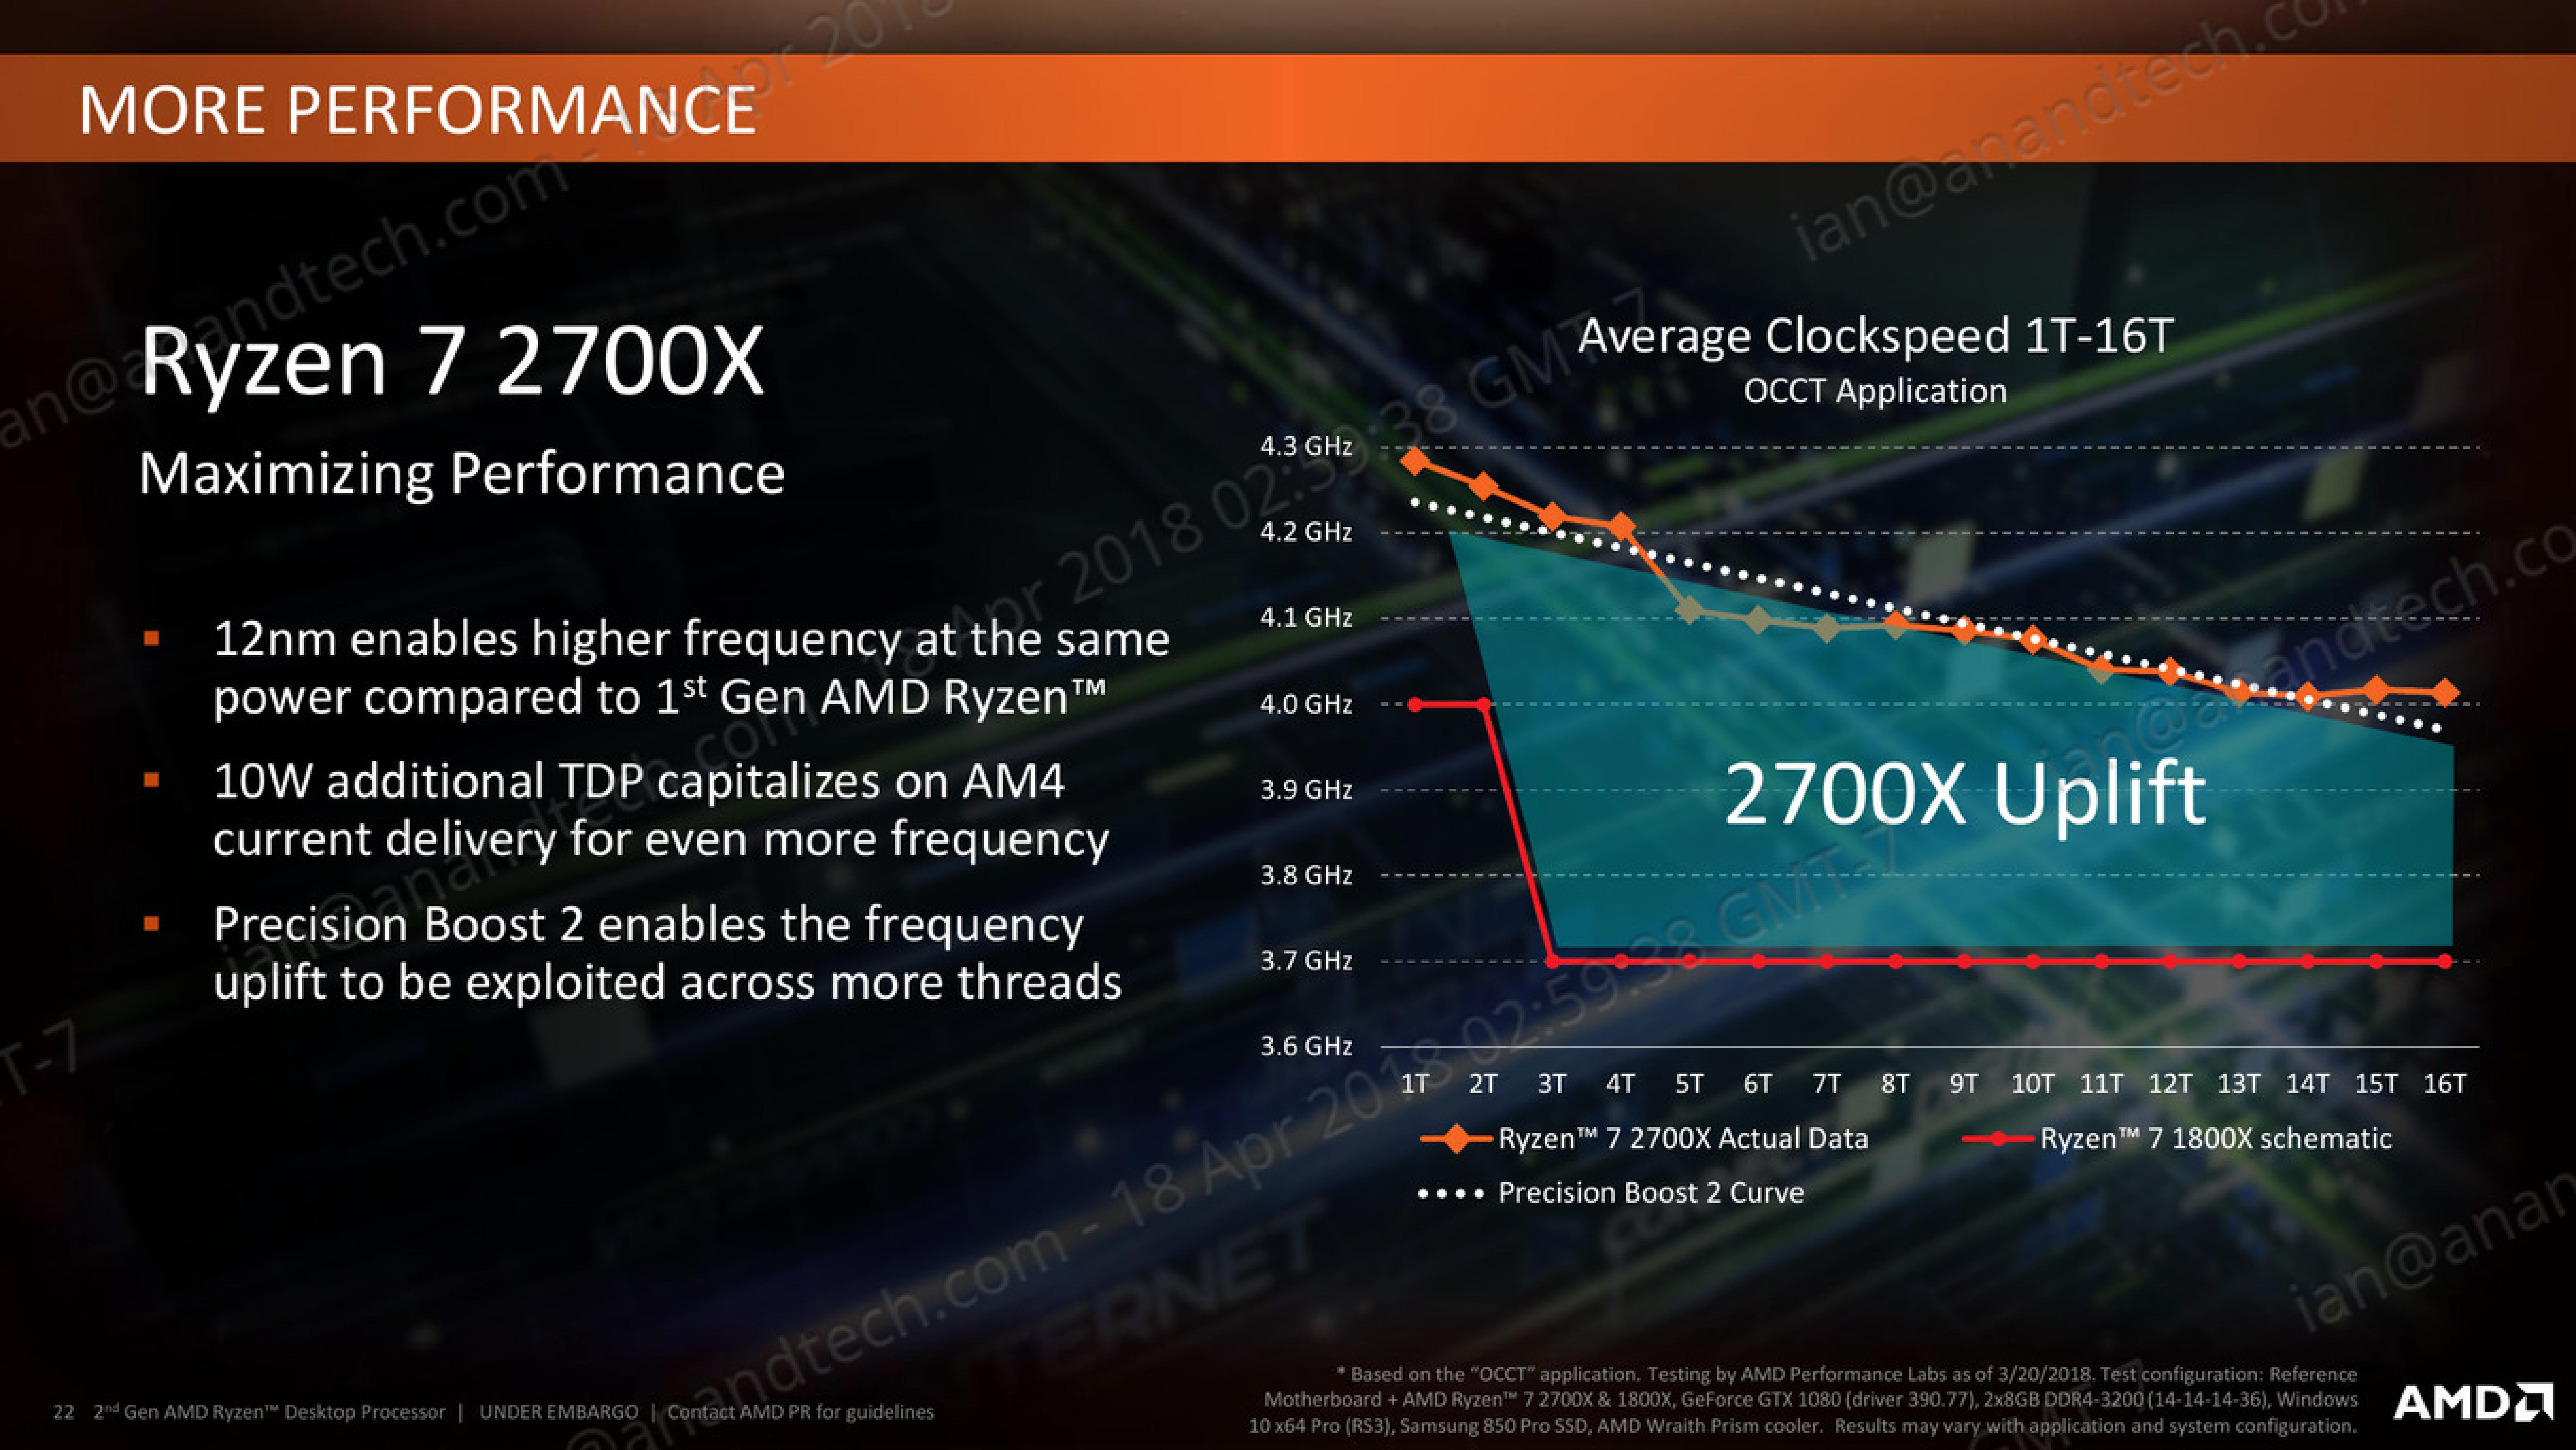
For the Ryzen 2000-series, AMD has changed what XFR does. In the previous generation it was applied on certain processors to allow them to boost above the maximum turbo frequency when the thermal situation was conducive to higher frequencies and higher voltage in low thread-count states. For this generation, it still relates to thermals, however the definition is applied to any core loading: if the CPU is under 60ºC, the processor can boost no matter what the loading is above its Precision Boost 2 frequency (so why not get a better PB2 implementation?). The core still has to be within a suitable voltage/frequency window to retain stability, however.
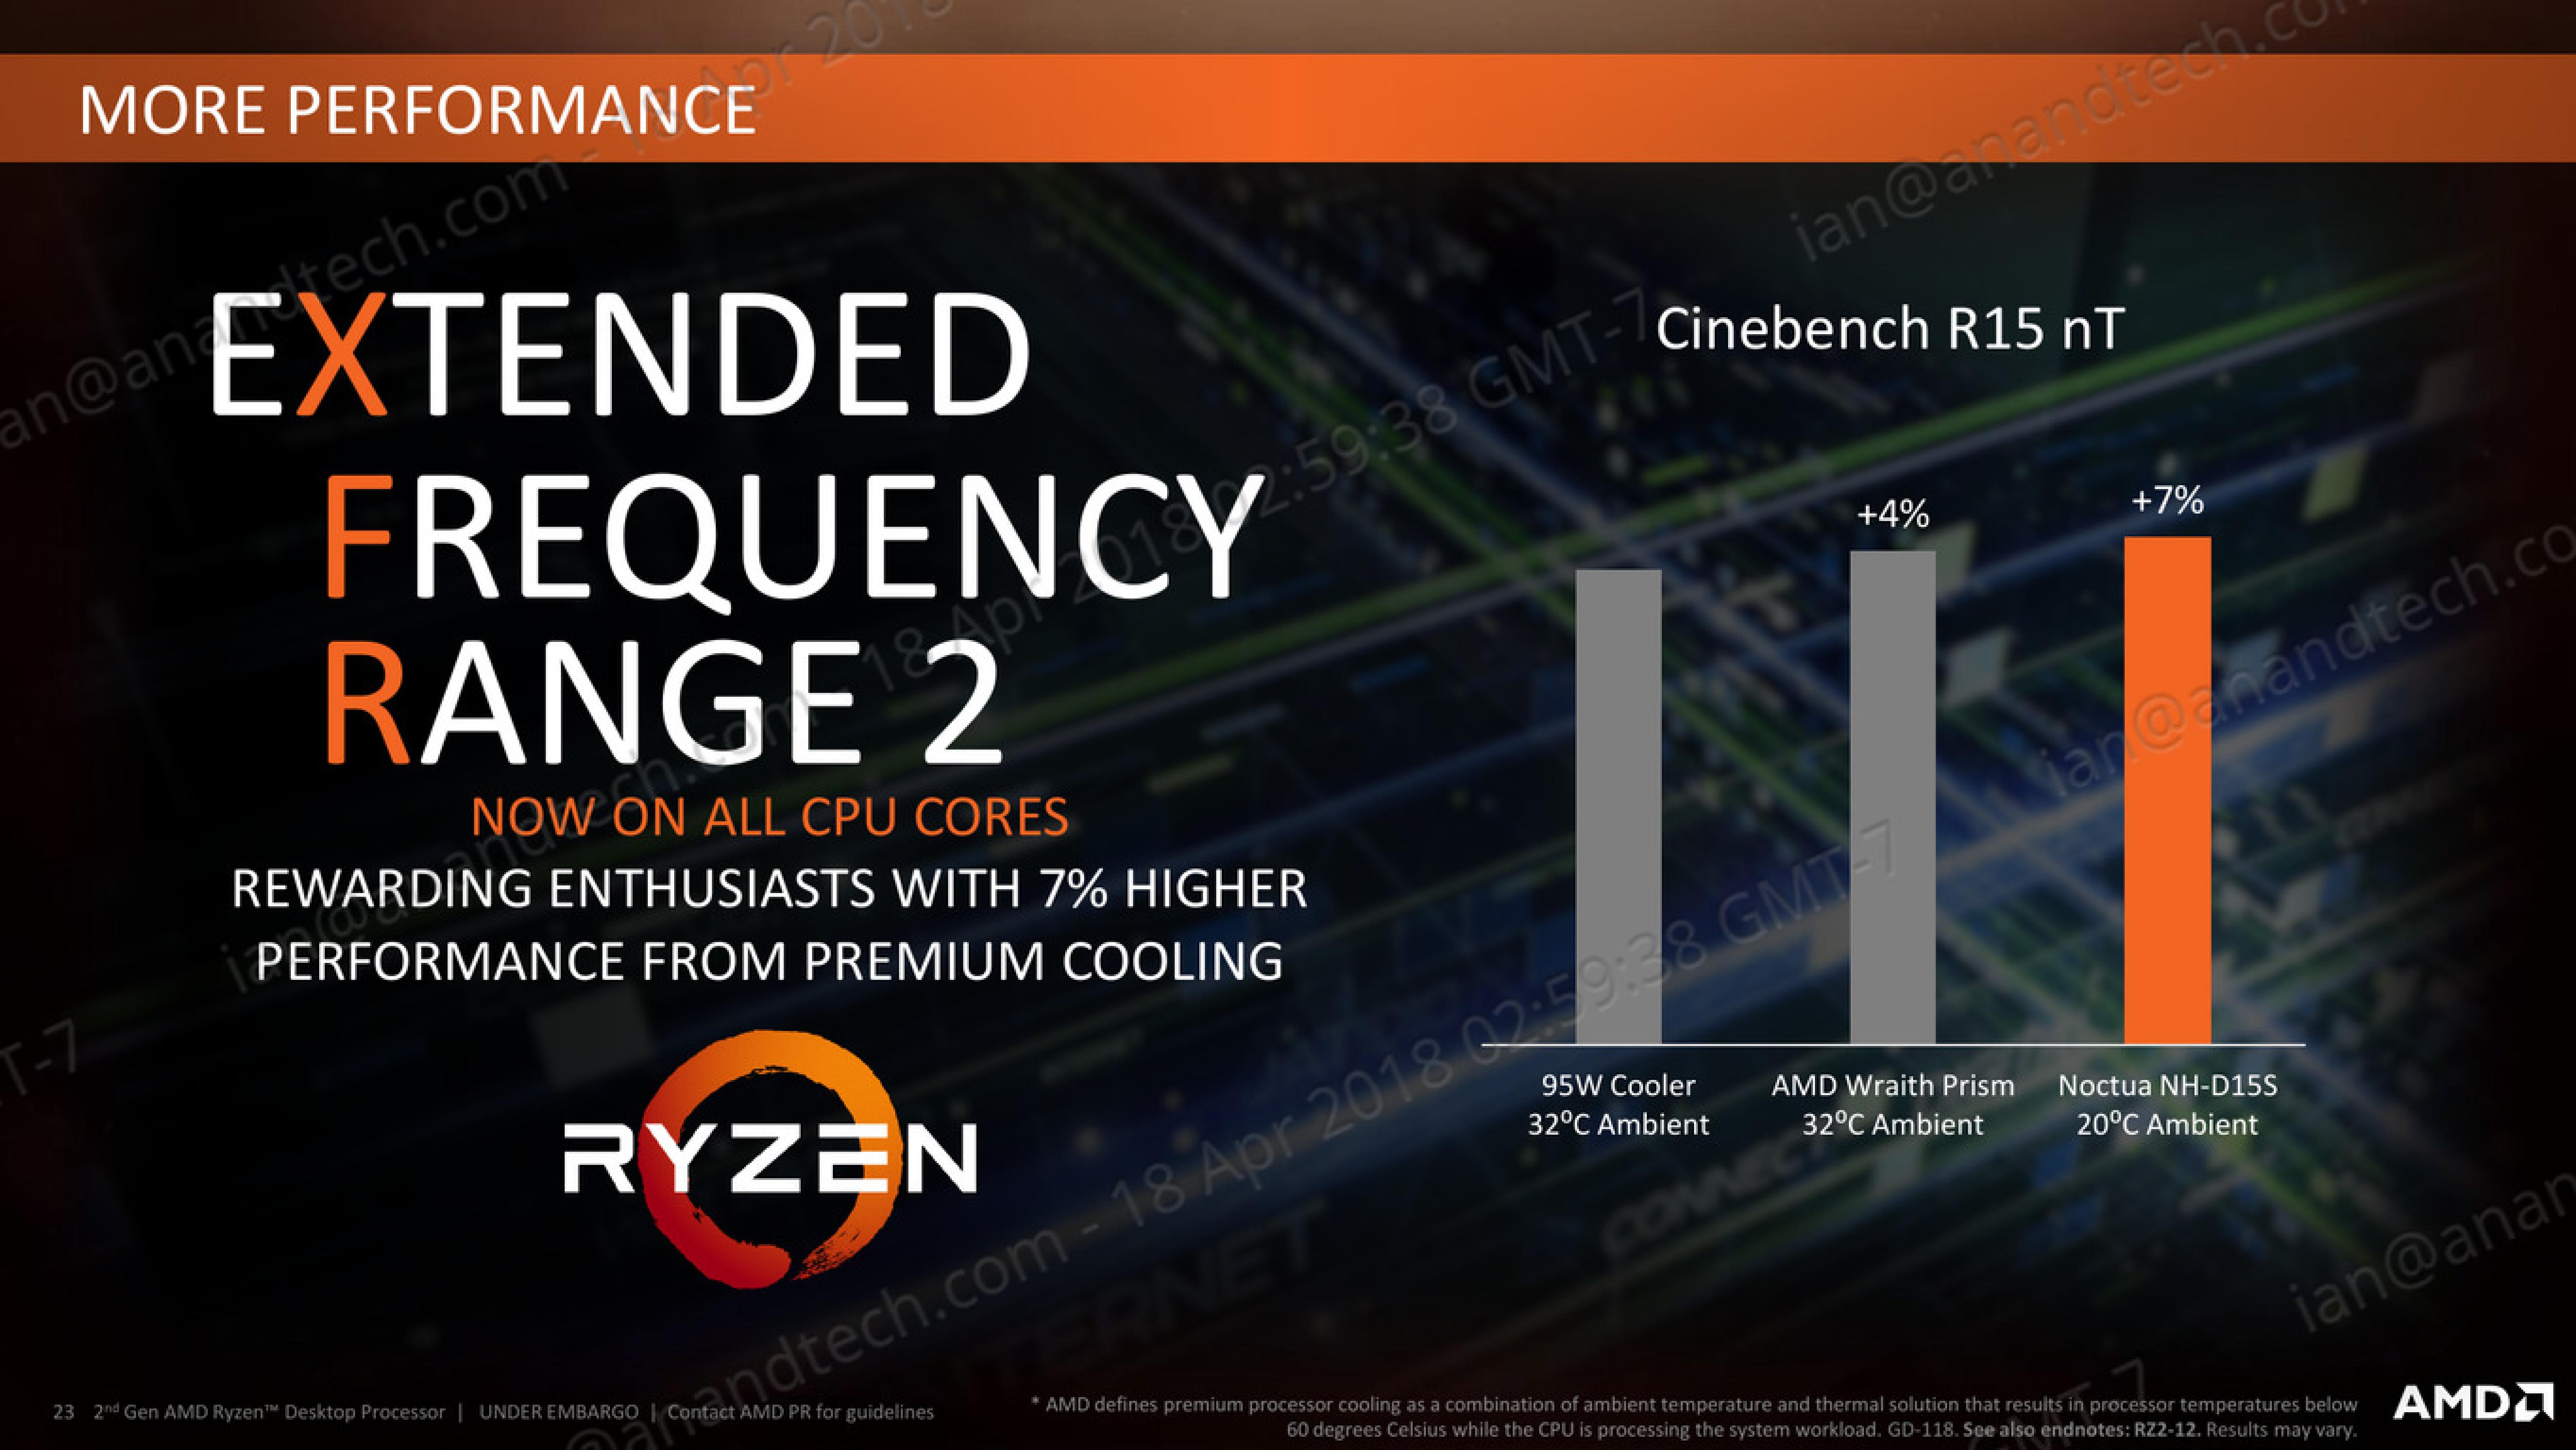
On certain motherboards, like the ASUS Crosshair VII Hero, there are additional options to assist XFR2 beyond AMD’s implementation. ASUS does not go into specific details, however I suspect it implements a more aggressive version, perhaps extending the voltage/frequency curve, raising the power limits, and/or adjusting the thermal limit.


545 Comments
View All Comments
John_M - Friday, May 11, 2018 - link
And still there's nothing on the StoreMI page. What's the excuse for that?AmbroseAthan - Friday, May 18, 2018 - link
Are we really over 3.5 weeks after this was updated as TBD, and you guys have fallen this far behind?This is not the standard I feel like Anandtech normally adheres to.
klatscho - Monday, May 21, 2018 - link
I second that.Maxiking - Monday, May 21, 2018 - link
LOL, the benchmarks are now updated, Ryzen+ absolutely outperformed in games by 8700k even with Meltdown and Spectre patches. So nothing new, Ryzen is still bad.klatscho - Monday, May 21, 2018 - link
If your usecase is 1080p gaming I would agree, however the difference becomes marginal as resolution increases. Also keep in mind that the 8700k currently retails for about $20 more than the 2700x and doesn't include a cooler, which means it is overall about $50 dearer...peevee - Tuesday, May 22, 2018 - link
"and the speed is limited to how the system reads from a drive that spins at 7200 or 5400 times per second"It is PER MINUTE. As in RPM.
cvearl - Friday, June 8, 2018 - link
My 2600 X at stock does 177 in single core cinebench. But that is with h100i V2 cooler. With the default cooler it gets the same score as you 173. The cooler the chip the higher the Boost. Also out-of-the-box XMP in the Bios Works 3200 no problem. In fact cl14. Out of the box versus my 1600 X in the exact same system it is 15% faster across the board.virpuain@gmail.com - Tuesday, June 19, 2018 - link
Nice review.On thing that bothers me is the inclusion of Winrar for this review without a note stating it is a underperforming compression tool. It is know that 7zip can compress almost twice as fast as Winrar.
Not that but also the lack of consistency in between compressions tests as instead of compressing and decrompressing a set file you are taking different procedures for each benchmark. I mean the job is to compress/decompress, let the user know how it does and why it does that.
0ldman79 - Monday, July 23, 2018 - link
I realize they probably don't have an FX 6300 and 83xx system for comparison.The FX 8350 scores 23719 MIPS on the 64 MB 7zip test, a good deal higher than the Kaveri or Bristol Ridge. I need to bench my 6300 just for giggles.
mrinmaydhar - Friday, July 27, 2018 - link
Try and run a S.M.A.R.T. test on the drives. The virtual adapter is unable to provide any data and causes a Blue-Screen. At least the last time I used the Enmotus version did.