The Plextor M8Pe (512GB) SSD Review
by Billy Tallis on December 14, 2016 9:00 AM ESTATTO
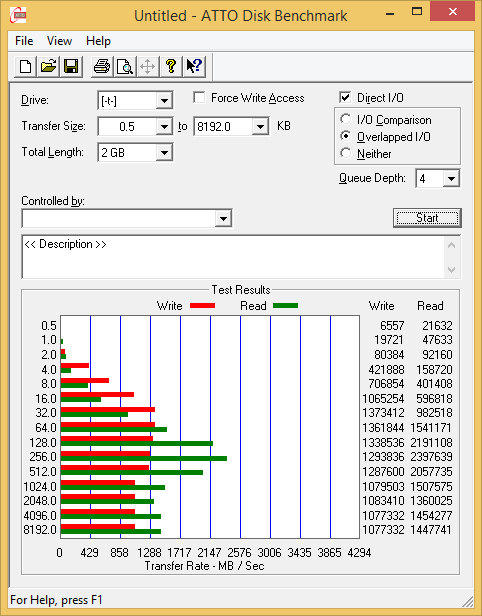
ATTO's Disk Benchmark is a quick and easy freeware tool to measure drive performance across various transfer sizes.
 |
|||||||||
The two configurations of the M8Pe ramp up identically as transfer size increases, but the M8PeGN without the heatsink starts throttling right after it hits full performance.
AS-SSD
AS-SSD is another quick and free benchmark tool. It uses incompressible data for all of its tests, making it an easy way to keep an eye on which drives are relying on transparent data compression. The short duration of the test makes it a decent indicator of peak drive performance.
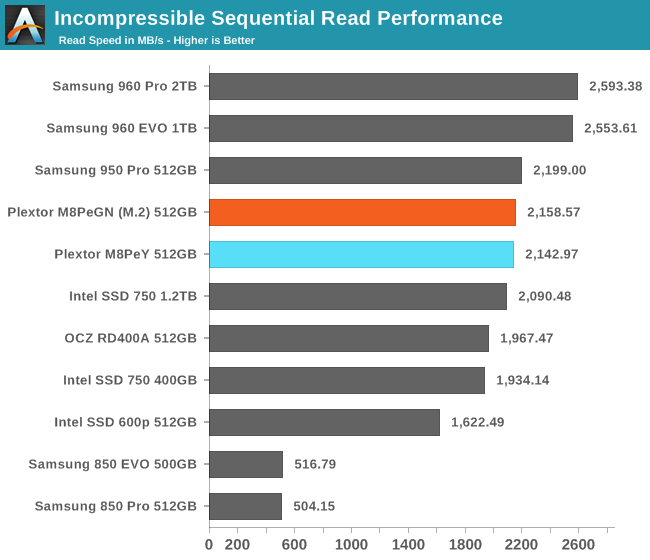
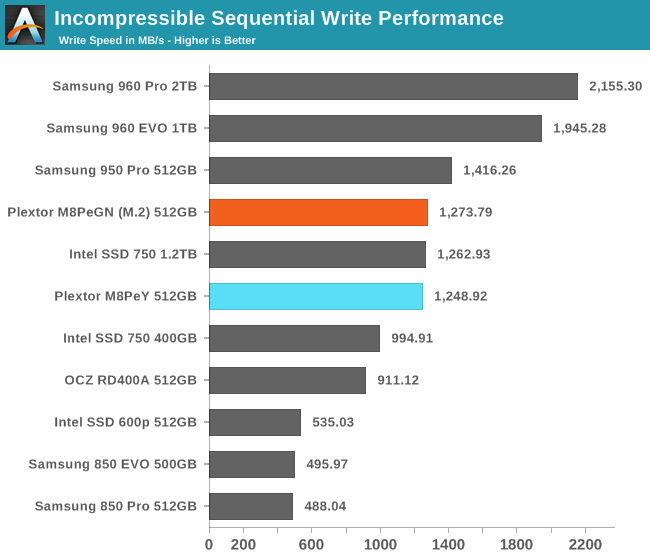
The M8Pe delivers short-duration sequential speeds that are second only to Samsung's PCIe SSDs, and tied with the much larger 1.2TB Intel SSD 750.
Idle Power Consumption
Since the ATSB tests based on real-world usage cut idle times short to 25ms, their power consumption scores paint an inaccurate picture of the relative suitability of drives for mobile use. During real-world client use, a solid state drive will spend far more time idle than actively processing commands.
There are two main ways that a NVMe SSD can save power when idle. The first is through suspending the PCIe link through the Active State Power Management (ASPM) mechanism, analogous to the SATA Link Power Management mechanism. Both define two power saving modes: an intermediate power saving mode with strict wake-up latency requirements (eg. 10µs for SATA "Partial" state) and a deeper state with looser wake-up requirements (eg. 10ms for SATA "Slumber" state). SATA Link Power Management is supported by almost all SSDs and host systems, though it is commonly off by default for desktops. PCIe ASPM support on the other hand is a minefield and it is common to encounter devices that do not implement it or implement it incorrectly. Forcing PCIe ASPM on for a system that defaults to disabling it may lead to the system locking up; this is the case for our current SSD testbed and thus we are unable to measure the effect of PCIe ASPM on SSD idle power.
The NVMe standard also defines a drive power management mechanism that is separate from PCIe link power management. The SSD can define up to 32 different power states and inform the host of the time taken to enter and exit these states. Some of these power states can be operational states where the drive continues to perform I/O with a restricted power budget, while others are non-operational idle states. The host system can either directly set these power states, or it can declare rules for which power states the drive may autonomously transition to after being idle for different lengths of time. NVMe power management including Autonomous Power State Transition (APST) fortunately does not depend on motherboard support the way PCIe ASPM does, so it should eventually reach the same widespread availability that SATA Link Power Management enjoys.
We report two idle power values for each drive: an active idle measurement taken with none of the above power management states engaged, and an idle power measurement with either SATA LPM Slumber state or the lowest-power NVMe non-operational power state, if supported.
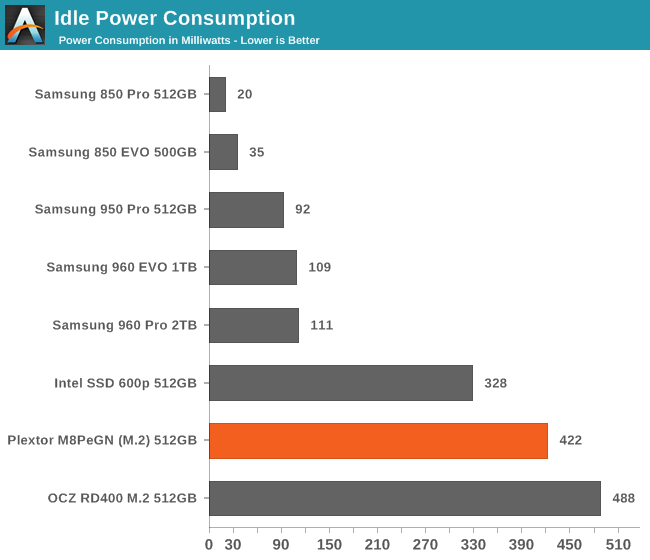
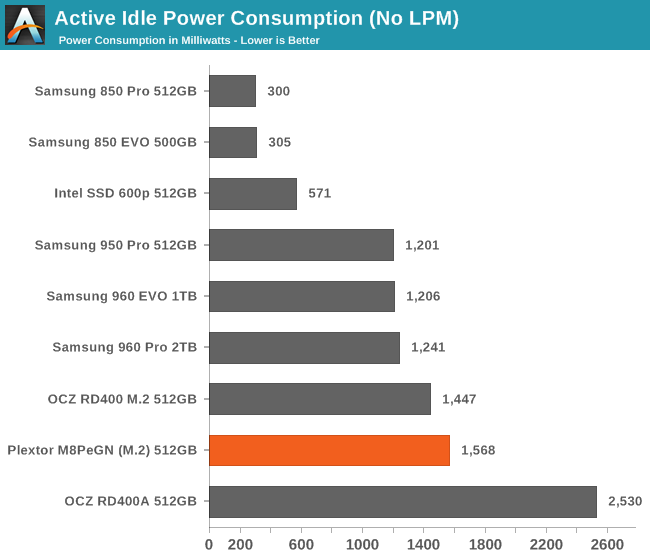
Samsung is still the only PCIe SSD vendor that has made significant progress with idle power management. Even when put into the lowest power state, The M8Pe (and the Intel 600p and OCZ RD400) consume more power than most idle SATA drives with no power saving features engaged.
When NVMe power management is not supported or not enabled, the Plextor M8Pe doesn't look too bad by comparison, as even Samsung's PCIe drives idle at 1.2 W compared to the M8Pe's 1.5 W.


64 Comments
View All Comments
DigitalFreak - Thursday, December 15, 2016 - link
Bullwinkle was actually a bit retarded, so the username fits.Bullwinkle J Moose - Friday, December 16, 2016 - link
My dear Mr Freak,I test actual numbers with a consistent hardware/software combination
If I get new hardware and software and the results for a specific SSD change by 1.7%, I can correct for the the new hardware/software for ALL of the SSD's tested without running new tests
With Synthetic benchmarks we cannot guarantee the accuracy between tests but more importantly the consistency between tests whenever you change test machines with different hardware/software/driver combo's
I can correct my results for different hardware and get reliably consistent results
You Cannot!
So you call ME the Retard?
You just don't get what it is that you just don't get
Meteor2 - Friday, December 16, 2016 - link
Watch your mouth. Until then, people won't respect you.BrokenCrayons - Friday, December 16, 2016 - link
"With Synthetic benchmarks we cannot guarantee..."Just like you've done in the past, you're advocating a controversial position you know will generate responses so you can get attention. Even if it's negative attention, you're still seeking it out.
MrSpadge - Thursday, December 15, 2016 - link
http://www.anandtech.com/show/10909/the-plextor-m8...1. Sequential read, QD1: 1500 MB/s
2. Sequential write, QD1: 1100 MB/s
http://www.anandtech.com/show/10909/the-plextor-m8...
3. Mixed sequential transfers, 50:50 distribution, QD1: 450 MB/s
Bullwinkle J Moose - Thursday, December 15, 2016 - link
MrSpadgeCan you show how these Synthetic Benchmarks relate to actual timed file transfers for accuracy?
If not, you are zero for three as well
Try comparing ACTUAL TIMED TRANSFERS for the copy/paste test I outlined on ANY SSD you currently own and compare it to the results given for synthetic results at this site!
Are they consistently repeatable and reliable?
How far off are they?
ZERO FOR THREE!
NEXT!
BrokenCrayons - Thursday, December 15, 2016 - link
I see you're trying to boost your self-esteem by attempting to discredit someone that tried to help you.Bullwinkle J Moose - Thursday, December 15, 2016 - link
Simply repeating incorrect numbers from a synthetic benchmark is no help to anyoneIf you want to at least make the numbers sound believable, try
1483.8 MB/s read
1136.9 MB/s write
437.2 MB/s mixed
not 1500 / 1100 / 450
still wrong but more believable
ZERO FOR THREE!
MrSpadge - Thursday, December 15, 2016 - link
By insisting on "TIMED TRANSFERS", do you imply this would be a better than reporting the average throughput? Keep in mind that determining the throughput requires a time measurement. the result is just normalized to the amount of transfered data to make it universally useful (not everyone is interested in monolithic 100 GB files).And you talk a lot about accuracy and repeatability. Well, I suspect the benchmarks from AT are just that. However, what is not accurate and repeatable is if I do just what you said: take any random computer and run that copy test. Things influencing such a test, to a varying degree:
- software used for copying
- filling state of the SSD
- wear of the NAND
- interface version used (SATA2?)
- mainboard: controller hardware & firmware
- OS
- storage driver
- additional caching software
- background activity (e.g. how many tabs are open in the browser? how is the add blocker configured?)
This list is not complete, of course. So when is a test meaningful, real world and simple enough for you? When it matches your system in each of those points? Then you won't find a single satisfying review on the web, unless you create it yourself. But be aware that your results won't apply directly to others, so people will complain that you tested in a strange way.
Bullwinkle J Moose - Thursday, December 15, 2016 - link
Quote: By insisting on "TIMED TRANSFERS", do you imply this would be a better than reporting the average throughput?---------------------------------
If I time the transfer of 100GB in 66.66 seconds, I get 1500MB/sec average throughput so not
sure of your point there
1GB / 10GB / 100GB or whatever, as long as the same value is used between drives under test to get a valid comparison between drives on the same hardware + Software (No additional Caching)
The rest of your argument is valid, You may pass!
Synthetic testing may be fine for you but the numbers are meaningless for me
Go with whatever works for you