The Plextor M8Pe (512GB) SSD Review
by Billy Tallis on December 14, 2016 9:00 AM ESTRandom Read Performance
The random read test requests 4kB blocks and tests queue depths ranging from 1 to 32. The queue depth is doubled every three minutes, for a total test duration of 18 minutes. The test spans the entire drive, which is filled before the test starts. The primary score we report is an average of performances at queue depths 1, 2 and 4, as client usage typically consists mostly of low queue depth operations.
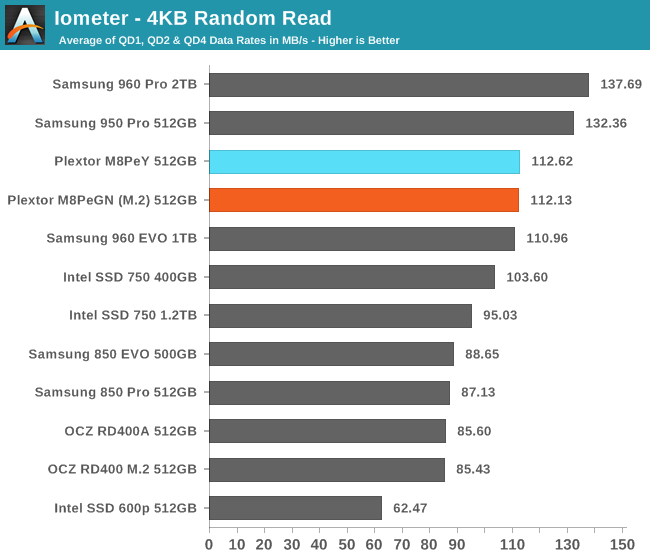
The Plextor M8Pe's random read speed cannot match Samsung's 3D MLC-based 950 Pro or 960 Pro, but it is otherwise very good. The 30% lead over the OCZ RD400 is particularly notable given that it uses the same NAND as the M8Pe.
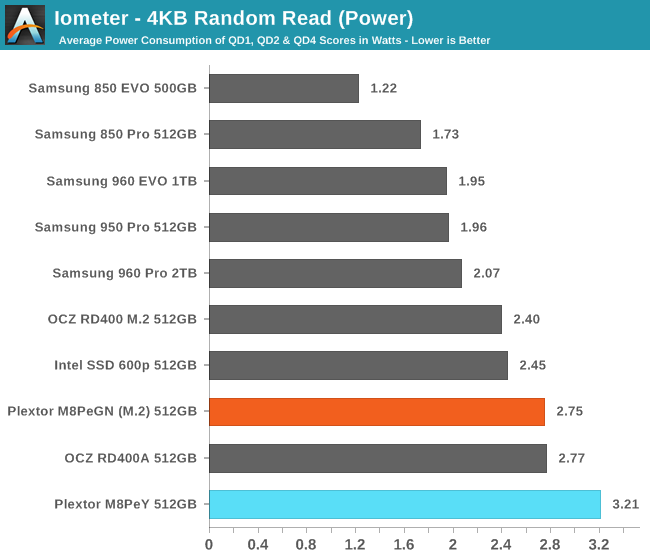
Power consumption is again higher than the rest of the M.2 PCIe SSDs, but given the good performance it does manage to be more efficient than the OCZ RD400.
 |
|||||||||
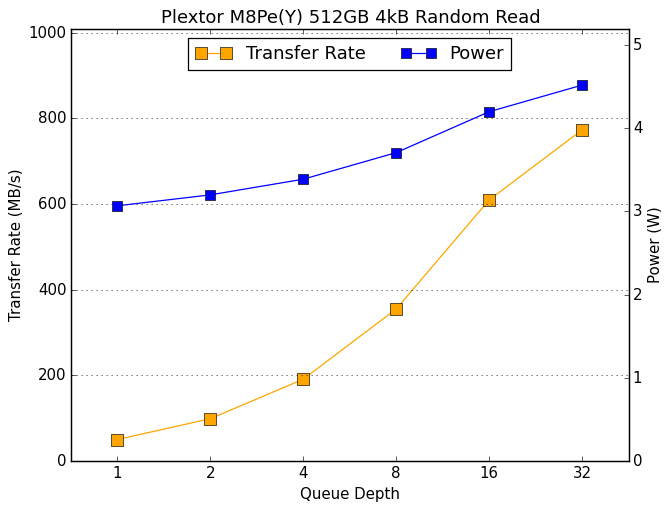
It appears that there is a little bit of thermal throttling happening on the M8PeGN in the final phase of the test at QD32, but otherwise it scales well as queue depths increase. Samsung's SSDs mostly saturate at QD16 while the M8Pe continues to scale up, albeit with diminishing returns.
Random Write Performance
The random write test writes 4kB blocks and tests queue depths ranging from 1 to 32. The queue depth is doubled every three minutes, for a total test duration of 18 minutes. The test is limited to a 16GB portion of the drive, and the drive is empty save for the 16GB test file. The primary score we report is an average of performances at queue depths 1, 2 and 4, as client usage typically consists mostly of low queue depth operations.
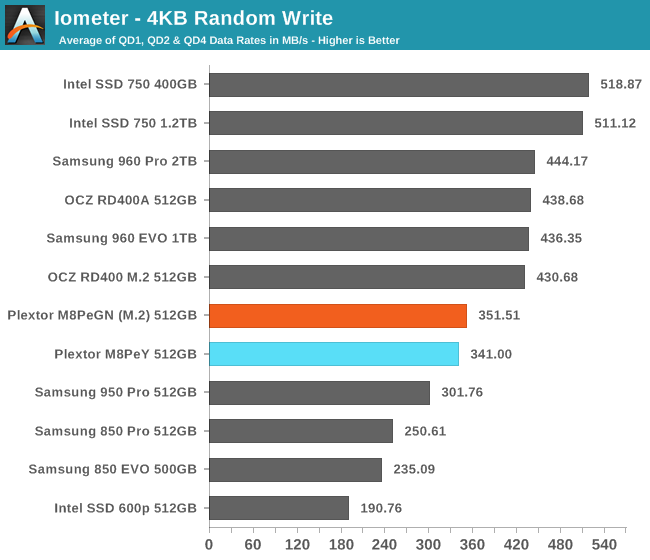
The random write performance of the Plextor M8Pe is better than the Samsung 950 Pro but falls behind more recent MLC-based PCIe SSDs, and Intel's SSD 750 is still the best.
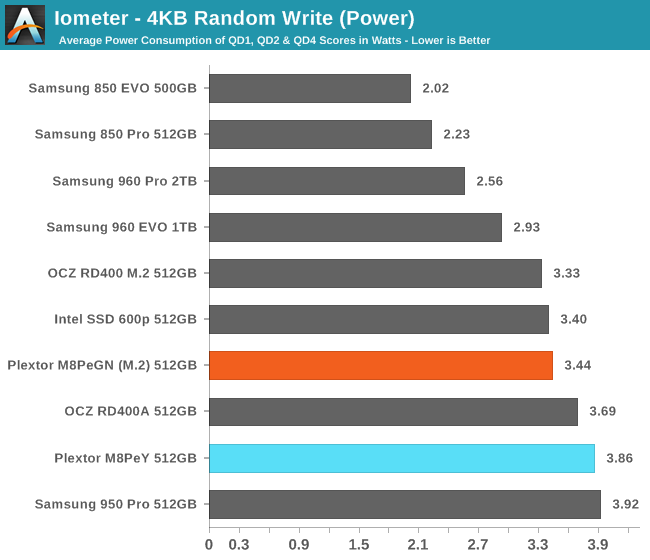
The M8Pe's power consumption is only slightly worse than the OCZ RD400, but its efficiency is still substantially worse. The Samsung 950 Pro had even higher power consumption and delivered what is now unimpressive random write performance, so the M8Pe isn't the least efficient of the MLC-based SSDs.
 |
|||||||||
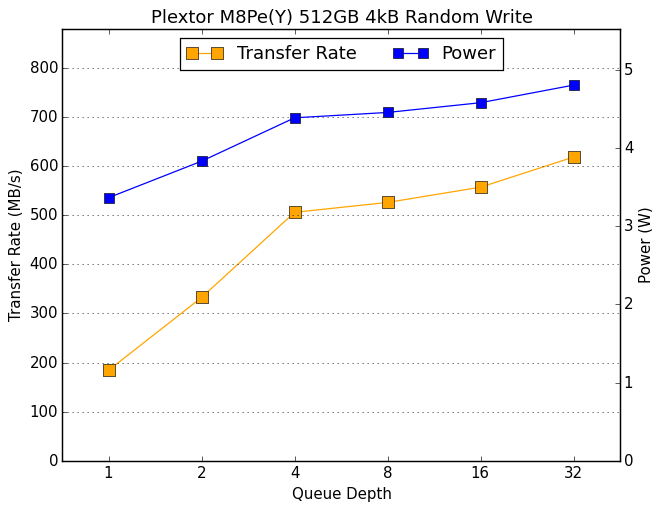
Performance increases relatively slowly for the M8PeY in the second half of the test, and actually decreases for the M8PeGN, indicating thermal throttling as power consumption hits 4 W.


64 Comments
View All Comments
DigitalFreak - Thursday, December 15, 2016 - link
Bullwinkle was actually a bit retarded, so the username fits.Bullwinkle J Moose - Friday, December 16, 2016 - link
My dear Mr Freak,I test actual numbers with a consistent hardware/software combination
If I get new hardware and software and the results for a specific SSD change by 1.7%, I can correct for the the new hardware/software for ALL of the SSD's tested without running new tests
With Synthetic benchmarks we cannot guarantee the accuracy between tests but more importantly the consistency between tests whenever you change test machines with different hardware/software/driver combo's
I can correct my results for different hardware and get reliably consistent results
You Cannot!
So you call ME the Retard?
You just don't get what it is that you just don't get
Meteor2 - Friday, December 16, 2016 - link
Watch your mouth. Until then, people won't respect you.BrokenCrayons - Friday, December 16, 2016 - link
"With Synthetic benchmarks we cannot guarantee..."Just like you've done in the past, you're advocating a controversial position you know will generate responses so you can get attention. Even if it's negative attention, you're still seeking it out.
MrSpadge - Thursday, December 15, 2016 - link
http://www.anandtech.com/show/10909/the-plextor-m8...1. Sequential read, QD1: 1500 MB/s
2. Sequential write, QD1: 1100 MB/s
http://www.anandtech.com/show/10909/the-plextor-m8...
3. Mixed sequential transfers, 50:50 distribution, QD1: 450 MB/s
Bullwinkle J Moose - Thursday, December 15, 2016 - link
MrSpadgeCan you show how these Synthetic Benchmarks relate to actual timed file transfers for accuracy?
If not, you are zero for three as well
Try comparing ACTUAL TIMED TRANSFERS for the copy/paste test I outlined on ANY SSD you currently own and compare it to the results given for synthetic results at this site!
Are they consistently repeatable and reliable?
How far off are they?
ZERO FOR THREE!
NEXT!
BrokenCrayons - Thursday, December 15, 2016 - link
I see you're trying to boost your self-esteem by attempting to discredit someone that tried to help you.Bullwinkle J Moose - Thursday, December 15, 2016 - link
Simply repeating incorrect numbers from a synthetic benchmark is no help to anyoneIf you want to at least make the numbers sound believable, try
1483.8 MB/s read
1136.9 MB/s write
437.2 MB/s mixed
not 1500 / 1100 / 450
still wrong but more believable
ZERO FOR THREE!
MrSpadge - Thursday, December 15, 2016 - link
By insisting on "TIMED TRANSFERS", do you imply this would be a better than reporting the average throughput? Keep in mind that determining the throughput requires a time measurement. the result is just normalized to the amount of transfered data to make it universally useful (not everyone is interested in monolithic 100 GB files).And you talk a lot about accuracy and repeatability. Well, I suspect the benchmarks from AT are just that. However, what is not accurate and repeatable is if I do just what you said: take any random computer and run that copy test. Things influencing such a test, to a varying degree:
- software used for copying
- filling state of the SSD
- wear of the NAND
- interface version used (SATA2?)
- mainboard: controller hardware & firmware
- OS
- storage driver
- additional caching software
- background activity (e.g. how many tabs are open in the browser? how is the add blocker configured?)
This list is not complete, of course. So when is a test meaningful, real world and simple enough for you? When it matches your system in each of those points? Then you won't find a single satisfying review on the web, unless you create it yourself. But be aware that your results won't apply directly to others, so people will complain that you tested in a strange way.
Bullwinkle J Moose - Thursday, December 15, 2016 - link
Quote: By insisting on "TIMED TRANSFERS", do you imply this would be a better than reporting the average throughput?---------------------------------
If I time the transfer of 100GB in 66.66 seconds, I get 1500MB/sec average throughput so not
sure of your point there
1GB / 10GB / 100GB or whatever, as long as the same value is used between drives under test to get a valid comparison between drives on the same hardware + Software (No additional Caching)
The rest of your argument is valid, You may pass!
Synthetic testing may be fine for you but the numbers are meaningless for me
Go with whatever works for you