Samsung SSD 845DC EVO/PRO Performance Preview & Exploring IOPS Consistency
by Kristian Vättö on September 3, 2014 8:00 AM ESTPerformance Consistency - Standard Deviation
The second new data set is standard deviation. It gives us a more comprehensive idea of how the average IOPS really varies because in the end, worst-case IOPS is just showing the slowest IO of every second. That does not tell how the rest of the IOs are doing, which is where standard deviation becomes useful.
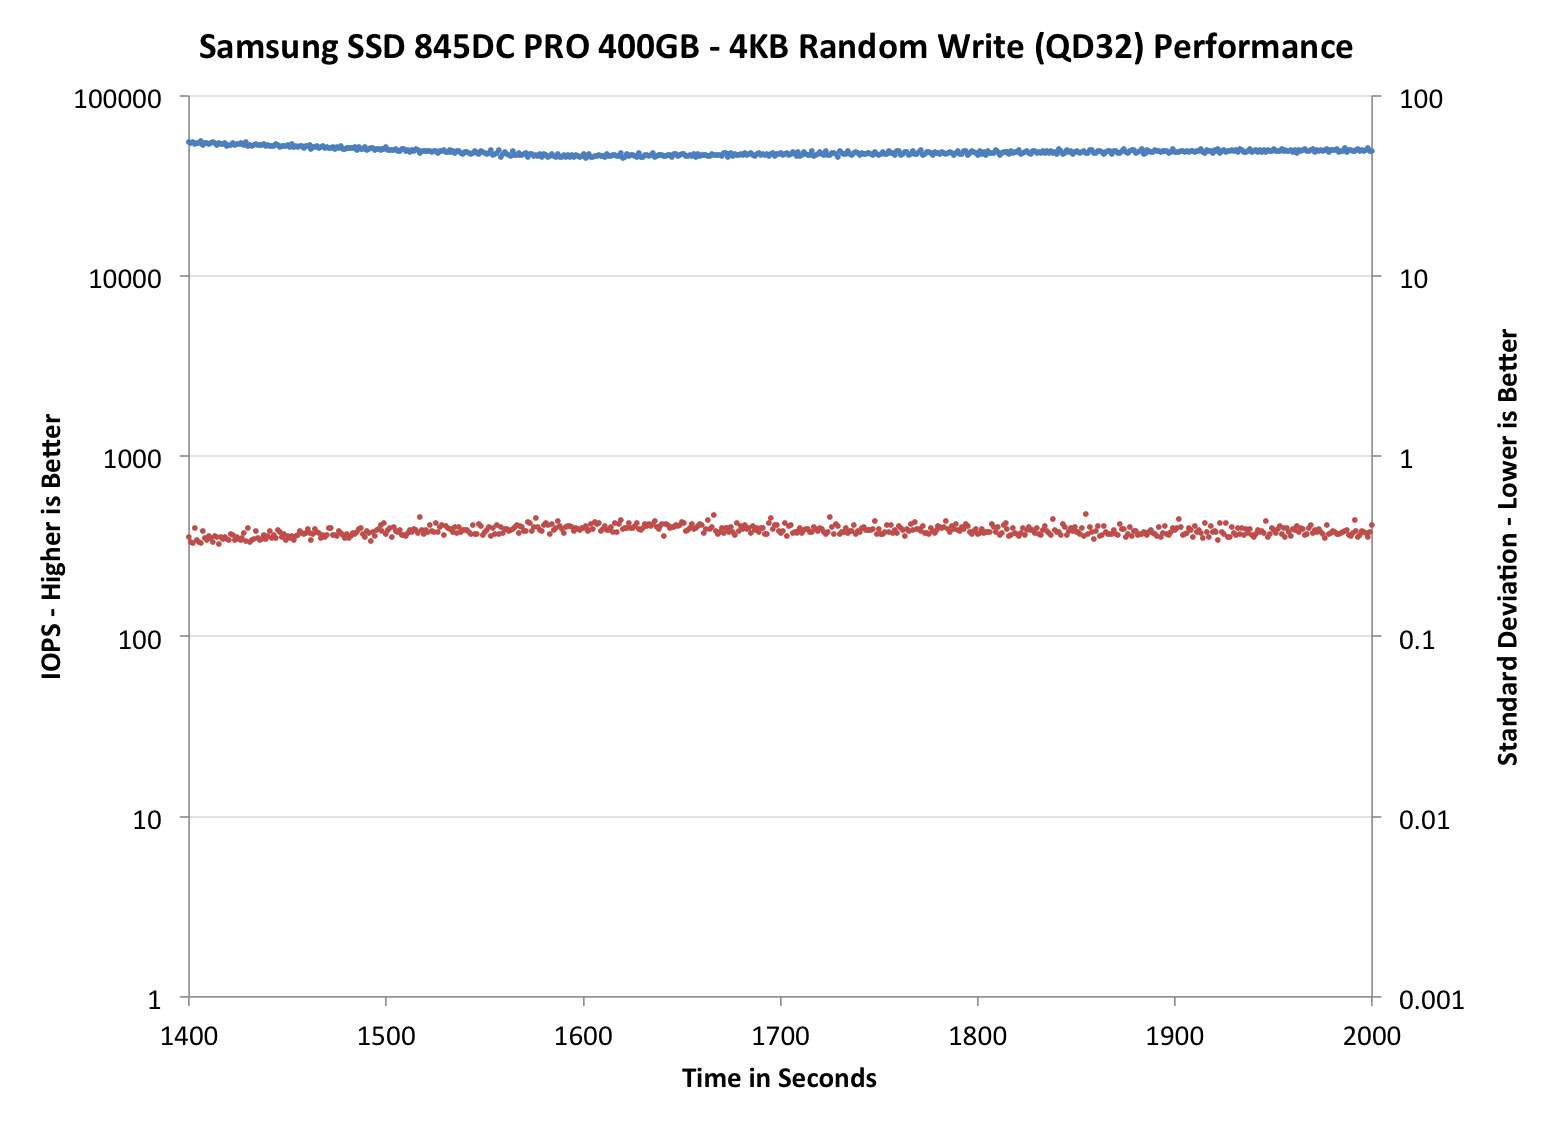
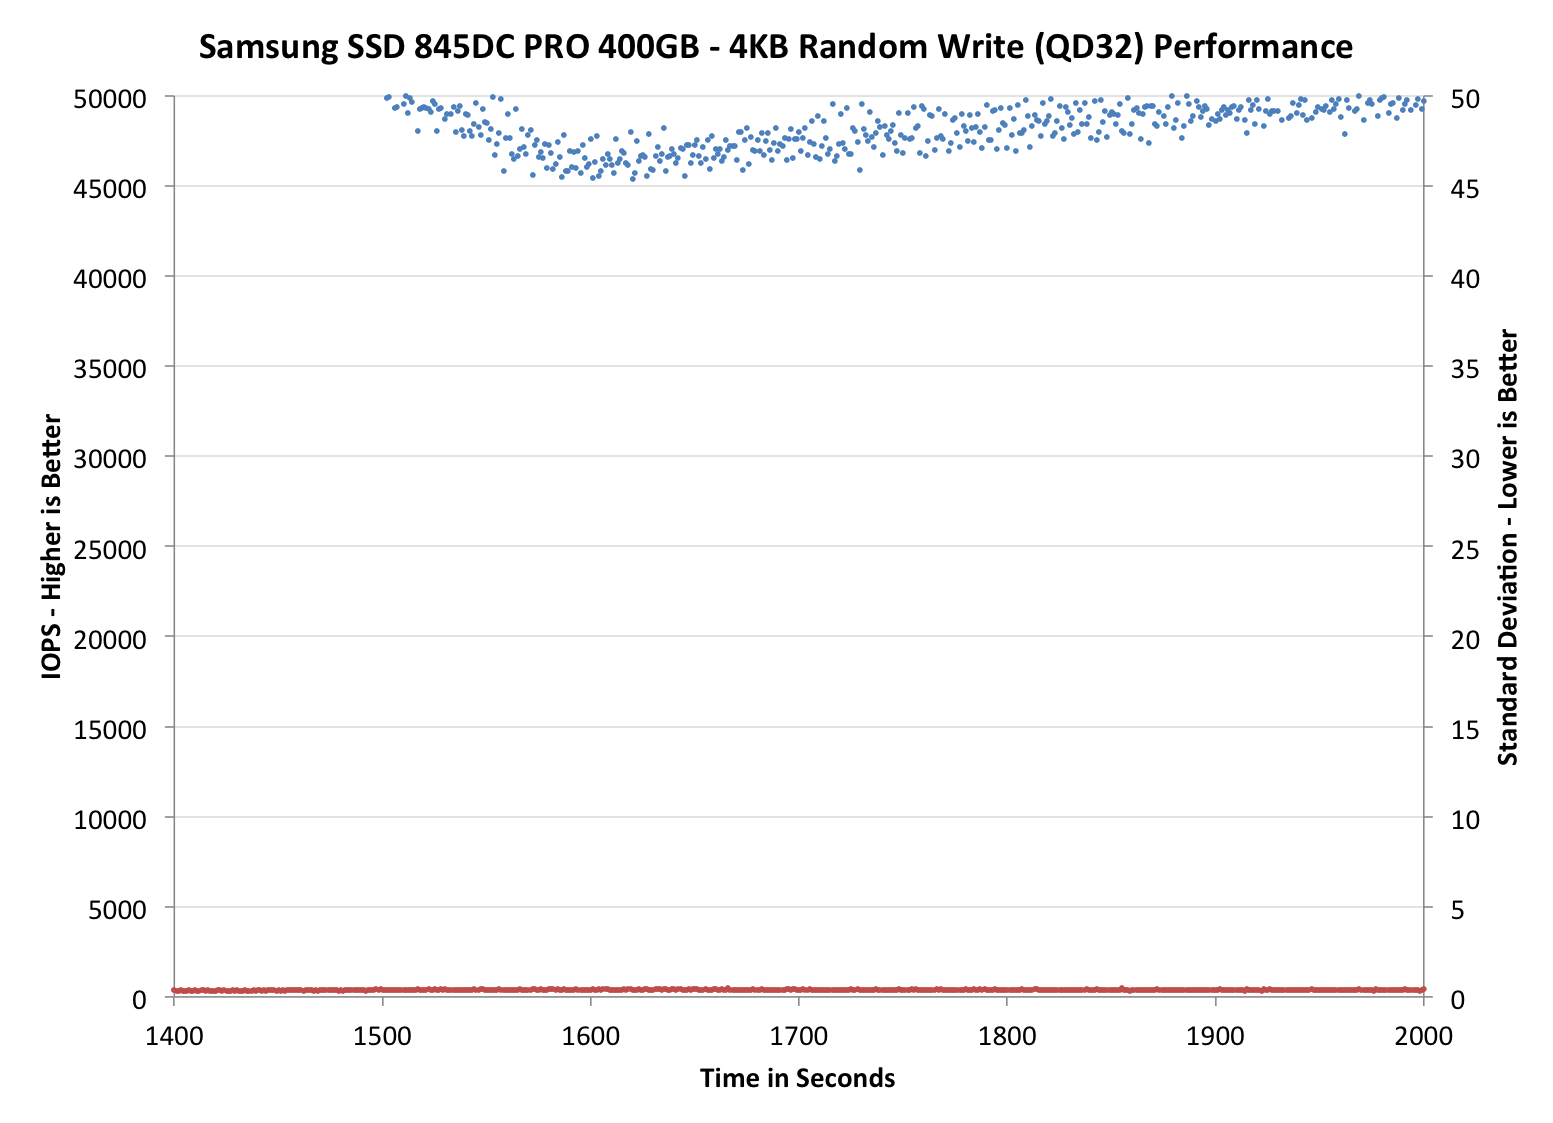
Once again, the blue dots represent average IOPS, while the red dots are now standard deviation instead of worst-case IOPS. The graphs are dual-axis with IOPS on the left and standard deviation on the right with its own scale. For these graphs, the lower the standard deviation, the less variance there is in performance and the more consistent the performance is, which is better.
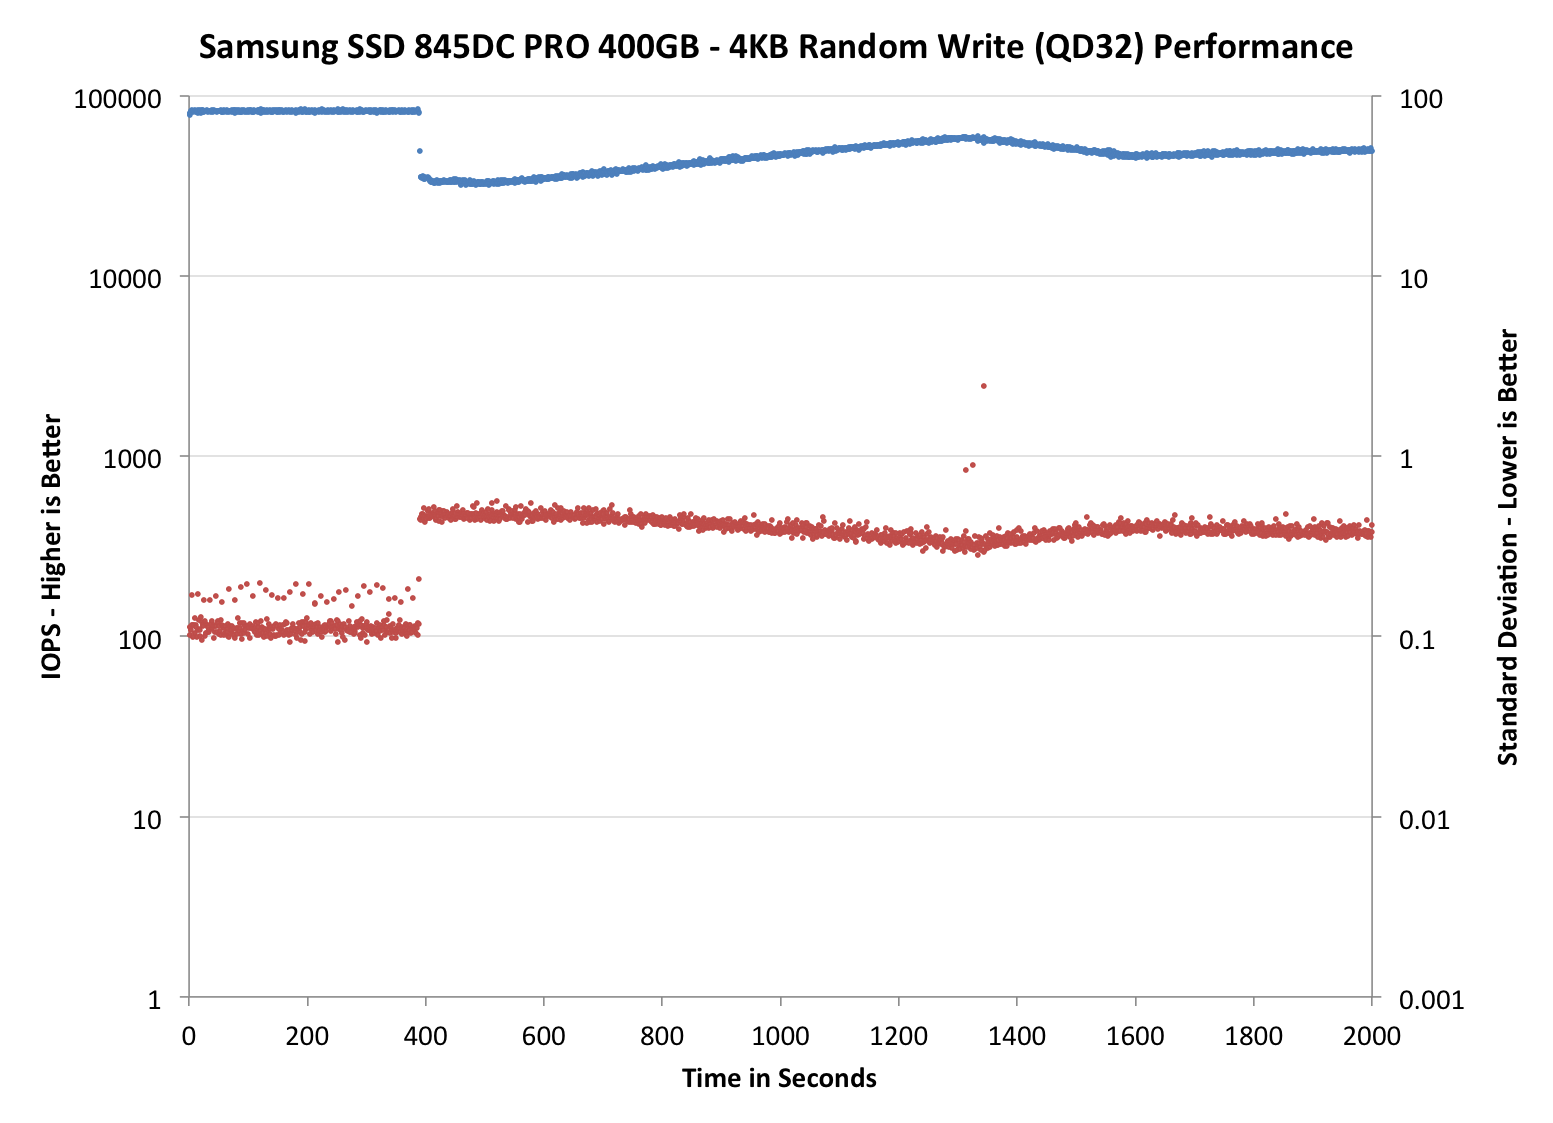
The 845DC EVO and PRO are awesome again. The EVO sports a standard deviation of around one, which is slightly better than what the S3500 offers and significantly better than M500DC's. Given that EVO's IOPS is very comparable with the S3500's, the EVO presents some serious competition to Intel despite the fact that the EVO uses slower TLC NAND with the same 12.7% over-provisioning.
The PRO does even better and is without a doubt the most consistent enterprise SATA SSD. The S3700 comes close, but when you include that fact that the 845DC PRO provides around 15K more IOPS, there is no doubt that it is a better drive for write intensive workloads that require high consistency.


31 Comments
View All Comments
hojnikb - Wednesday, September 3, 2014 - link
Looks like, they ain't doing Turbowrite on TLC models :)Kristian Vättö - Wednesday, September 3, 2014 - link
TurboWrite wouldn't make any sense on an enterprise drive because all that matters is sustained performance. Client drives are a different case because IO activity tends to happen in bursts, so having a fast buffer is beneficial (and it makes the drive look better in benchmarks).hojnikb - Wednesday, September 3, 2014 - link
Yeah i figured as much. Aside from being more suited for short bursts (as you'd said) its really great for marketing department, since they can slap magical 500MB/s+ speeds, that every uninformed buyer is after. 500MB/s sure sells a lot better than 250MB/s (or even less, if we're dealing with lower capacities) :)Spirall - Wednesday, September 3, 2014 - link
Thanks for the article. Would suggest to make a $/manufacturer declared write endurance comparison (PB writen until manufacturer write warranty end). If there's a chance (due to the difficult on testing time) also make a $/tested write life (PB writen until tested dead).Kristian Vättö - Wednesday, September 3, 2014 - link
$/endurance is certainly something I will be looking at in the future. This was more of a preview than a full review and in the full review I will have more graphs and comparisons to support the conclusions :)As for actual endurance testing, that is something I will not do. It took me two weeks of continuos writing to get the rated endurance to drop by 1% in the 845DC PRO, so it would take way too long to wait for the drive to die.
hojnikb - Wednesday, September 3, 2014 - link
And there is a good chance, that thing would still go strong after rated endurance would drop to 0% (unless its hardcapped to die after that).Essence_of_War - Wednesday, September 3, 2014 - link
Another excellent article, Kristian.A question/comment, though, do you think it would make more sense to report the stdev measurements as an "error bar" attached to each data point rather than an additional graph with a 2nd y-axis? I think that might be more compact without having to worry about having multiple y-scales to read. Then it might even be possible to plot an average + error bars data set for multiple different SSDs on the same axis w/o having to worry about which curve is the avg, which curve is the stdev, etc.
hulu - Wednesday, September 3, 2014 - link
Another way to present the standard deviation data would be to draw it in two average +/- stdev graphs above and below the average graph. This would better allow visualizing the actual values the average minus stdev has.Kristian Vättö - Thursday, September 4, 2014 - link
Thanks for the suggestion. I will certainly look into alternative ways to present the standard deviation. I need to redo the graphs anyway for our new suite, so while I'm at it I can see if there is a better way to present the data.Essence_of_War - Thursday, September 4, 2014 - link
Best luck then, I'm sure you'll figure out a good way to do it.