The Opteron 6276: a closer look
by Johan De Gelas on February 9, 2012 6:00 AM EST- Posted in
- IT Computing
- CPUs
- Bulldozer
- AMD
- Opteron
- Cloud Computing
- Interlagos
Threading Tricks or Not?
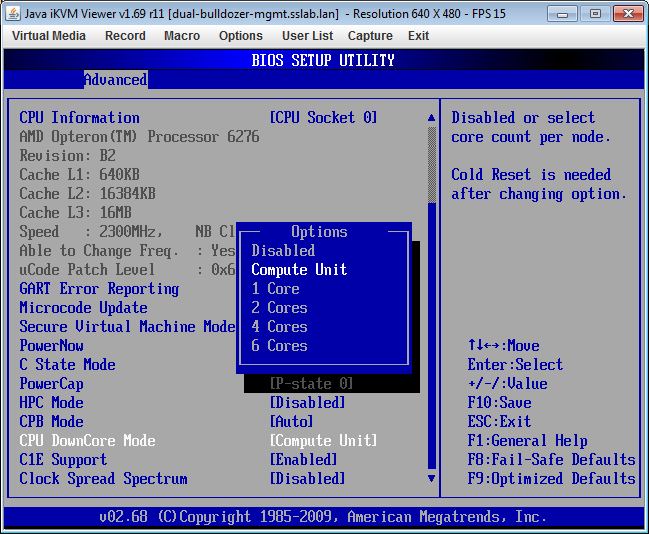
AMD claimed more than once that Clustered Multi Threading (CMT) is a much more efficient way to crunch through server applications than Simultaneous Multi Threading (SMT), aka Hyper-Threading (HTT). We wanted to check this, so for our next tests we disabled and enabled CMT and HTT. Below you can see how we disabled CMT in the Supermicro BIOS Setup:
First, we look at raw throughput (TP in the table). All measurements were done with the "High Performance" power policy.
| Concurrency | CMT | No CMT |
TP Increase CMT vs. No CMT |
HTT | No HTT |
TP Increase HTT vs. No HTT |
| 25 | 24 | 24 | 100% | 24 | 25 | 100% |
| 40 | 39 | 39 | 100% | 39 | 39 | 100% |
| 80 | 77 | 77 | 100% | 78 | 78 | 100% |
| 100 | 96 | 96 | 100% | 97 | 98 | 100% |
| 125 | 120 | 118 | 101% | 122 | 122 | 100% |
| 200 | 189 | 183 | 103% | 193 | 192 | 100% |
| 300 | 275 | 252 | 109% | 282 | 278 | 102% |
| 350 | 312 | 269 | 116% | 321 | 315 | 102% |
| 400 | 344 | 276 | 124% | 350 | 339 | 103% |
| 500 | 380 | 281 | 135% | 392 | 367 | 107% |
| 600 | 390 | 286 | 136% | 402 | 372 | 108% |
| 800 | 389 | 285 | 137% | 405 | 379 | 107% |
Only at 300 concurrent users (or queries per second) do the CPUs start to get close their maximum throughput (around 400 q/s). At around that point is where the multi-threading technologies start to pay off.
It is interesting to note that the average IPC of one MS SQL Server thread is about 0.95-1.0 (measured with Intel vTune). That is low enough to have quite a few unused execution slots in the Xeon, which is ideal for Hyper-Threading. However, Hyper-Threading is only capable of delivering a 3-8% performance boost.
On the AMD Opteron we measured an IPC of 0.72-0.8 (measured with AMD CodeAnalyst). That should also be more than low enough to allow two threads to pass through the shared front-end without obstructing each other. While it is not earth shattering, CMT does not disappoint: we measure a very solid 24-37% increase in throughput. Now let's look at the response times (RT in the table).
| Concurrency | CMT | No CMT |
RT Increase (CMT vs. No CMT) |
HTT | No HTT |
RT Increase HTT vs. No HTT |
| 25 | 29 | 28.5 | 2%* | 20.4 | 18.9 | 8%* |
| 40 | 31.1 | 32.1 | -3% * | 21.7 | 20.3 | 7%* |
| 80 | 36 | 39 | -9%* | 24 | 23 | 2%* |
| 100 | 39 | 46 | -14% | 28 | 25 | 13% |
| 125 | 46 | 57 | -20% | 28 | 28 | 0% |
| 200 | 59 | 92 | -35% | 38 | 40 | -4% |
| 300 | 92 | 189 | -51% | 62 | 79 | -21% |
| 350 | 121 | 303 | -60% | 91 | 112 | -19% |
| 400 | 164 | 452 | -64% | 143 | 182 | -21% |
| 500 | 320 | 788 | -59% | 278 | 335 | -17% |
| 600 | 545 | 1111 | -51% | 498 | 621 | -20% |
| 800 | 1003 | 1825 | -45% | 989 | 1120 | -12% |
* Difference between results is within error margin and thus unreliable.
The SQL server software engine shows excellent scaling and is ideal for CMT and Hyper-Threading. CMT seems to reduce the response time even at low loads. This is not the case for Hyper-Threading, but we must be careful to interpret the results. At the lower concurrencies, the response times measured are so small that they fall within the error margin. A 21.7 ms response time is indeed 7% more than a 20.3 ms response time, but the error margin of these measurements is much higher at these very low concurrencies than at the higher concurrencies, so take these percentages with a grain of salt.
What we can say is that Hyper-Threading only starts to reduce the response times when the CPU goes beyond 50% load. CMT reduces the response times much more than HTT, but the non-CMT response times are already twice (and more) as high as the non-HTT response times.
In the end, both multi-threading technologies improve performance. CMT seems to be quite a bit more efficient than SMT; however, it must be said that the Xeon with HTT disabled already offers response times that are much lower than the Opteron without CMT. So you could also argue the other way around: the Xeon already does a very good job of filling its pipelines (IPC of 1 versus 0.72), and there is less headroom available.


46 Comments
View All Comments
tech6 - Thursday, February 9, 2012 - link
We have a number of these in our data center and they have been a disappointment. Single threaded performance is low and the memory sharing performance under VMWare is poor. That leaves it only competitive for DB and web servers work which is OK but it doesn't make a compelling case for the architecture as similar Intel offerings perform well in all tasks. AMD still has a small price advantage, but once you add the VMWare licensing and data center costs the percentage difference is negligible.duploxxx - Thursday, February 9, 2012 - link
Typical answers, I debate such results all the time with many IT departments all over the world so called "standardized on and runs bette on" statements. So you have a large number of these new Opteron 6200 series already in datacenter and already got this info out of it, yeah right. Our virtual datacenters with approx 1000 servers exist out of AMD based systems, the only time i thought about swapping to intel after performance/price/power review was when intel released the Nehalem (oh and perhaps the Socket R but can't disclose that yet, neither do I want to swap that fast knowing that abu dhabi is about to go in Beta samples already). In the low price 2s-4s (not talking about the over expensive EX versions) the AMD are still owning the virtualization with there multicore and more memory channels with lower price.Poor single thread has indeed been an issue for magny cours to a certain extend but not that it is noticable on a normal level of applications (you sound like a superpi user that only looks at theoretical results), poor memory sharing, care that to explain :). I suggest you have a look at general best practices on power settings for virtualized environments before complaining about response and throughput.
These response time result measured here are not noticable in any general application and once adding some kernel overhead from NFS/iscsi or whatever in medium - high load servers forcing these tasks to HT cores will show quite a bit different result in platform performance. Anandtech Vapp results from are nice but are still not a full reflection of datacenter performance and the results are heavy influenced by the webapp which clearly seems to favor the Intel architecture. Neither does have the Vapp testing any iscsi/nfs kernel related tasks which many sites do have (to reduce infrastructure cost)
Vmware licensing cost more for AMD? only for the enterprise edition, the abandoned vmware license version which was introduced again for v4 because of OEM pressure... time to investigate more before buying anything... advanced - enterprise plus has no difference for any core you would select and neither does v5 have.
JohanAnandtech - Thursday, February 9, 2012 - link
NFS/iSCSI: you seem to ignore the fact that besides OLTP, many apps (especially OLAP and web) run mostly out of memory. The whole idea of good data management is to make sure that your requests come out of memory. We have webcaches, database caches, file system caches, RAID caches and on disk caches...all these caches are made to make sure that the response time is NOT dominated by NFS/iSCSI.We have 5 years of experience building our vAPUS stresstesting client (not vApp) so don't discard our results so quickly.
duploxxx - Thursday, February 9, 2012 - link
I won't discard them as I said they are a of great value just like these testing posted today, but that doesn't change the fact that in current vApus stresstesting there is no use of NAS/ISCSI datastores which is very common these days now that 10G is affordable and creates additional overhead on systems, mostly not accounted for when selecting a platform. Sure for the review real performance conclusion are needed from cpu architectures and then this setup remains totally applicable. But you get people which i tried to answer before who take this final score result for granted and leverage it over a total platform as if that is the best choice.Second remains the fact that the final vApus calculation is based on all scores and the web based VM score is unbalancing the final score. I mentioned that years ago when the vApus1 and 2 were introduced, back in the old days.
haplo602 - Friday, February 10, 2012 - link
nothing that features heavy modifications will run out of memory .... do you cache your database redologs ? bad idea.similar for web servers that get heavy modifications.
all the caches exist to only make the transition between respons time jumps less painfull, but they never remove those limits.
if you have a static system (reads 99% of the time) then you can use caches a lot. untill the data set grows too large to cache and is sufficiently random.
Iketh - Thursday, February 9, 2012 - link
This was a fun read. Unfortunately, the thought still in the back of my mind while reading was why in the hell did AMD reinvent the P4??? I just don't get it.I hope the coorporate players who resigned fired some engineers prior...
duploxxx - Thursday, February 9, 2012 - link
very interesting info as usual, thx for the indepth review.In general I think it would be added value to mention what exact BIOS and power mngmnt settings have been set. Since the option exist of using PCC controlled power (BIOS - OEM) or through the OS, also settings like CE6 etc does influence the final results a lot on turbo etc, mainly towards your preliminary review and this one it's not always clear what exactly you have been using.
result wise it is very strange that the 16core does not scale further then the 12core in SQL, for the reference testing that would give clear results when you could have tested the 6234-6238 which are also 12core versions. It is hard to believe that these 16core do not scale further, that they lack about 10-15% IPC @ same ghz sure but not raw performance in core count.
Debatable is the fact that while using Dual rank 4MC on AMD and using 2 rows Dual rank 3MC on the intel, dual row dual rank will give more bandwidth, its not AMD fault they have 4MC vs intel only 3MC.... even Intel next gen will have a serie of 3MC and 4MC..... but this should not result in major differences.
Last point, which IS a fact --> the price compare. While listed price might be comparable, reallity is quite a bit different in retail sales price. For large volume handling the discount between vendor is huge, the discount that Intel allows on it's CPU is way less then AMD, this changes the final cost price a lot.
JohanAnandtech - Thursday, February 9, 2012 - link
"In general I think it would be added value to mention what exact BIOS and power mngmnt settings have been set"Most of them can be seen at:
http://www.anandtech.com/show/5279/the-opteron-627...
C6 was enabled
"dual row dual rank will give more bandwidth"
You can easily reverse that argument: if I use 4 GB DIMMs on the AMD, the clockspeed of the DIMMs will throttle back to 1333. The AMD IMC can only use 1600 MHz with 1 DIMM per channel. So this is really the best case for AMD.
"For large volume handling the discount between vendor is huge"
ok. 1. those people are probably 0.001% of our readership. 2. Those prices are a moving and unknown target.
duploxxx - Thursday, February 9, 2012 - link
yes I have seen those settings, but during the review with so many back and forth testing showing issues on the power and bios settings from a reader perspective it is no longer clear what exact bios settings have been used (ms os - hypervisor) and what has been used and if results were updated with the right BIOS settings.I am not yet convinced that the 1600 is really added value for the 6200 series, perhaps it will be more added value on piledriver with enhancements. While 8GB ram prices did drop it is still not a default selection certainly not on 1600 speed. I did mention debatable memory :) did you test the difference in the Database benchmarks?
Its not only large volume where the discount is even greater, just look at the HP website and order 3 "similar" designs from the same vendor:
dl380 dual E5649 - 8gb ram : 5953$ (add 8gb ram + 150$ approx)
dl380 dual X5660 - 24gb ram: 7178$ (remove 8 gb ram -150$, identical PSU -100$)
dl385 dual 6272 - 16GB ram: 5202$
so you can see quite a bit different price range.
http://h71016.www7.hp.com/dstore/MiddleFrame.asp?p...
http://h71016.www7.hp.com/dstore/MiddleFrame.asp?p...
http://h71016.www7.hp.com/dstore/MiddleFrame.asp?p...
alpha754293 - Thursday, February 9, 2012 - link
Johan:I know that you and I have spoke a little bit offline about possibly doing more HPC and HPC-related testing.
I, for one, would still like to see more of that because I think that's one area that a) is underserved by hardware review sites (sometimes with good reason), b) I think that it stresses the CPUs more/harder, and c) you can create/do/use a consistent benchmark test cases or suite of applications (like you mentioned about the SPEC OpenMP (although they have an MPI one as well, which I think is probably going to be even better).
I think that the biggest downside is that the HPC applications DO take a fairly significant time to run. (Some of them runs for days on end - just to do one pass).
And you can always throw more Hypervisors onto these systems, but I don't think that they're nearly as taxing as when you're running a computationally heavy/demanding application like simulating a car crashing into a wall at 35 mph. :oD
And it's quite possible that you might be able to script the entire benchmarking process...