Fable Legends Early Preview: DirectX 12 Benchmark Analysis
by Ryan Smith, Ian Cutress & Daniel Williams on September 24, 2015 9:00 AM ESTDiscussing Percentiles and Minimum Frame Rates
Up until this point we have only discussed average frame rates, which is an easy number to generate from a benchmark run. Discussing minimum frame rates is a little tricky, because it could be argued that the time taken to render the worst frame should be the minimum. All it then takes is a bad GPU request (misaligned texture cache) which happens infrequently to provide skewed data. To this end, thanks to the logging functionality of the benchmark, we are able to report the frame rate profiles of each run and percentile numbers.
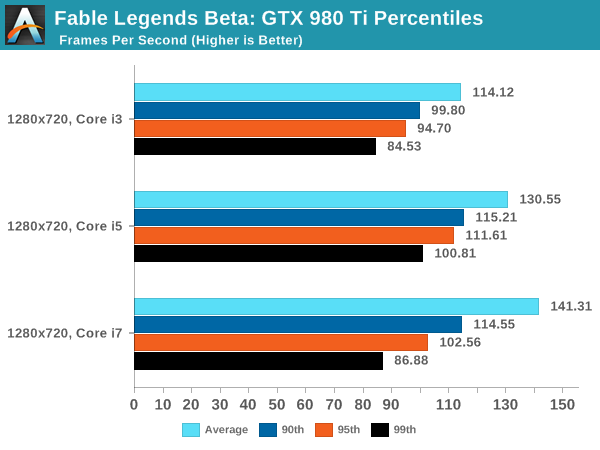
For the GTX 980 and AMD Fury X, we pulled out the 90th, 95th and 99th percentile data from the outputs, as well as plotting full graphs. For each of these data points, the 90th percentile should represent the frame rate (we’ll stick to reporting frame rates to simplify the matter) a game will achieve during 90% of the frames. Similar logic applies to the 95th and 99th percentile data, where these are closer to the absolute maximum but should be more consistent between runs.
This page (and the next) is going to be data heavy, but our analysis will discuss the effect of CPU scaling on percentile data on both GPUs in all three resolutions using all three CPUs. Starting with the GTX 980 Ti:
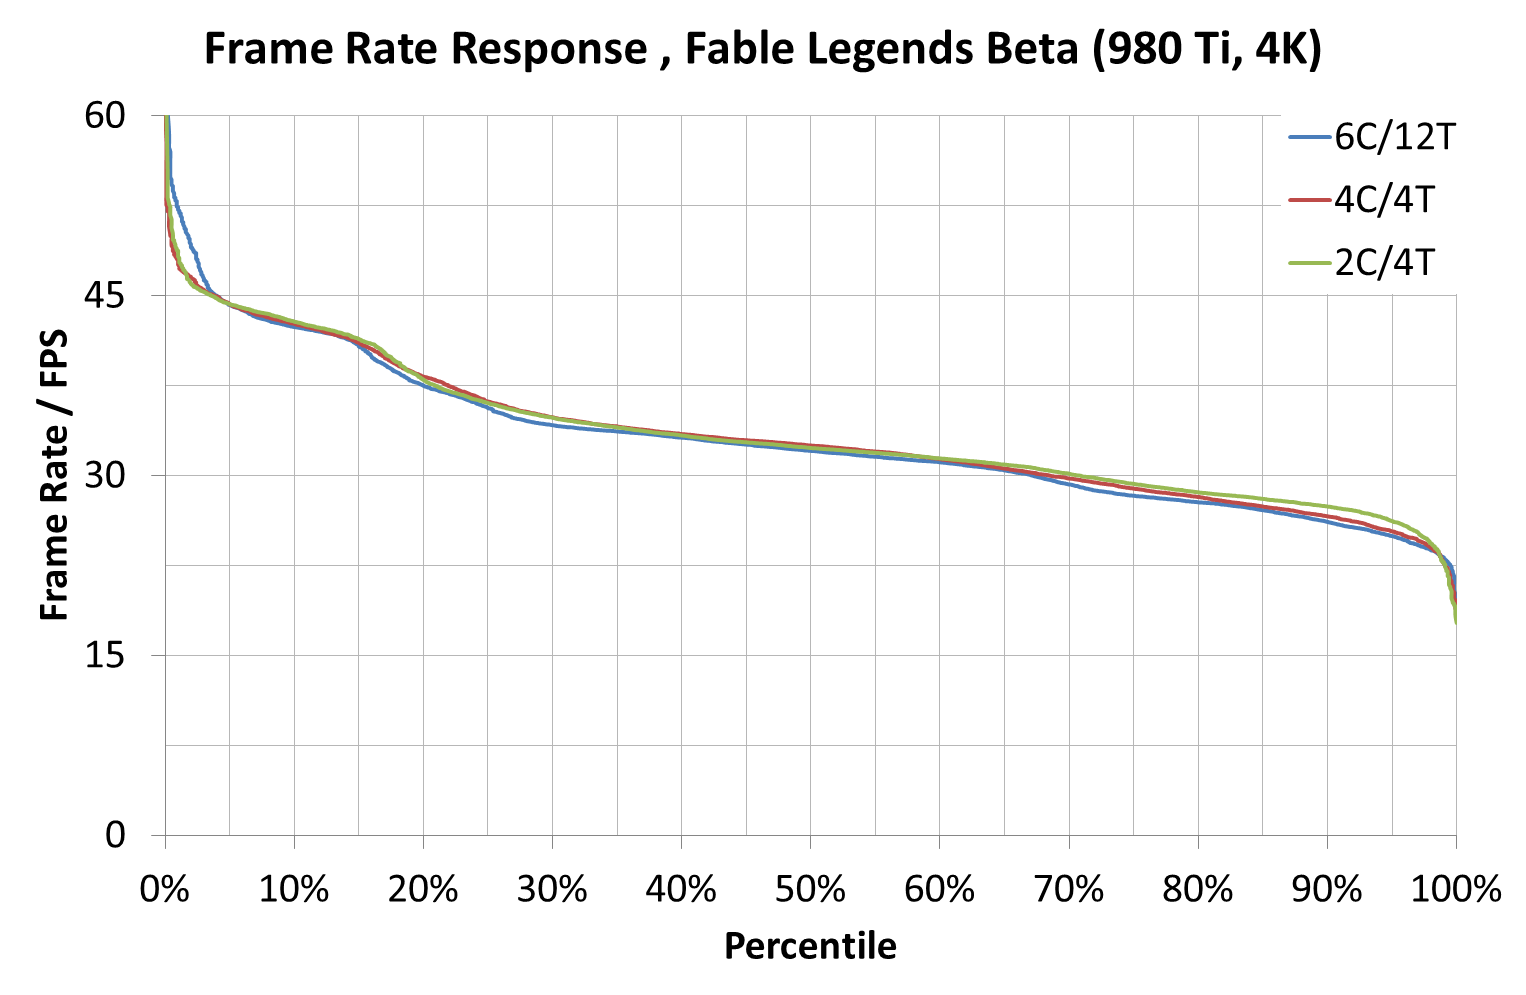
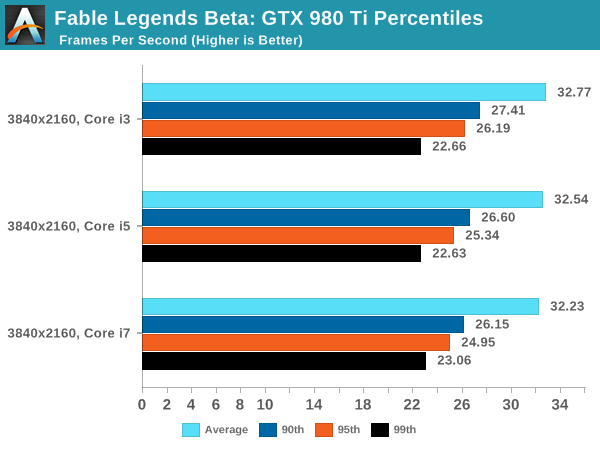
All three arrangements at 3840x2160 perform similarly, though there are slight regressions moving from the i3 to the i7 along most of the range, perhaps suggesting that having an excess of thread data has some issues. The Core i7 arrangement seems to have the upper hand at the low percentile (2%-4%) numbers as well.
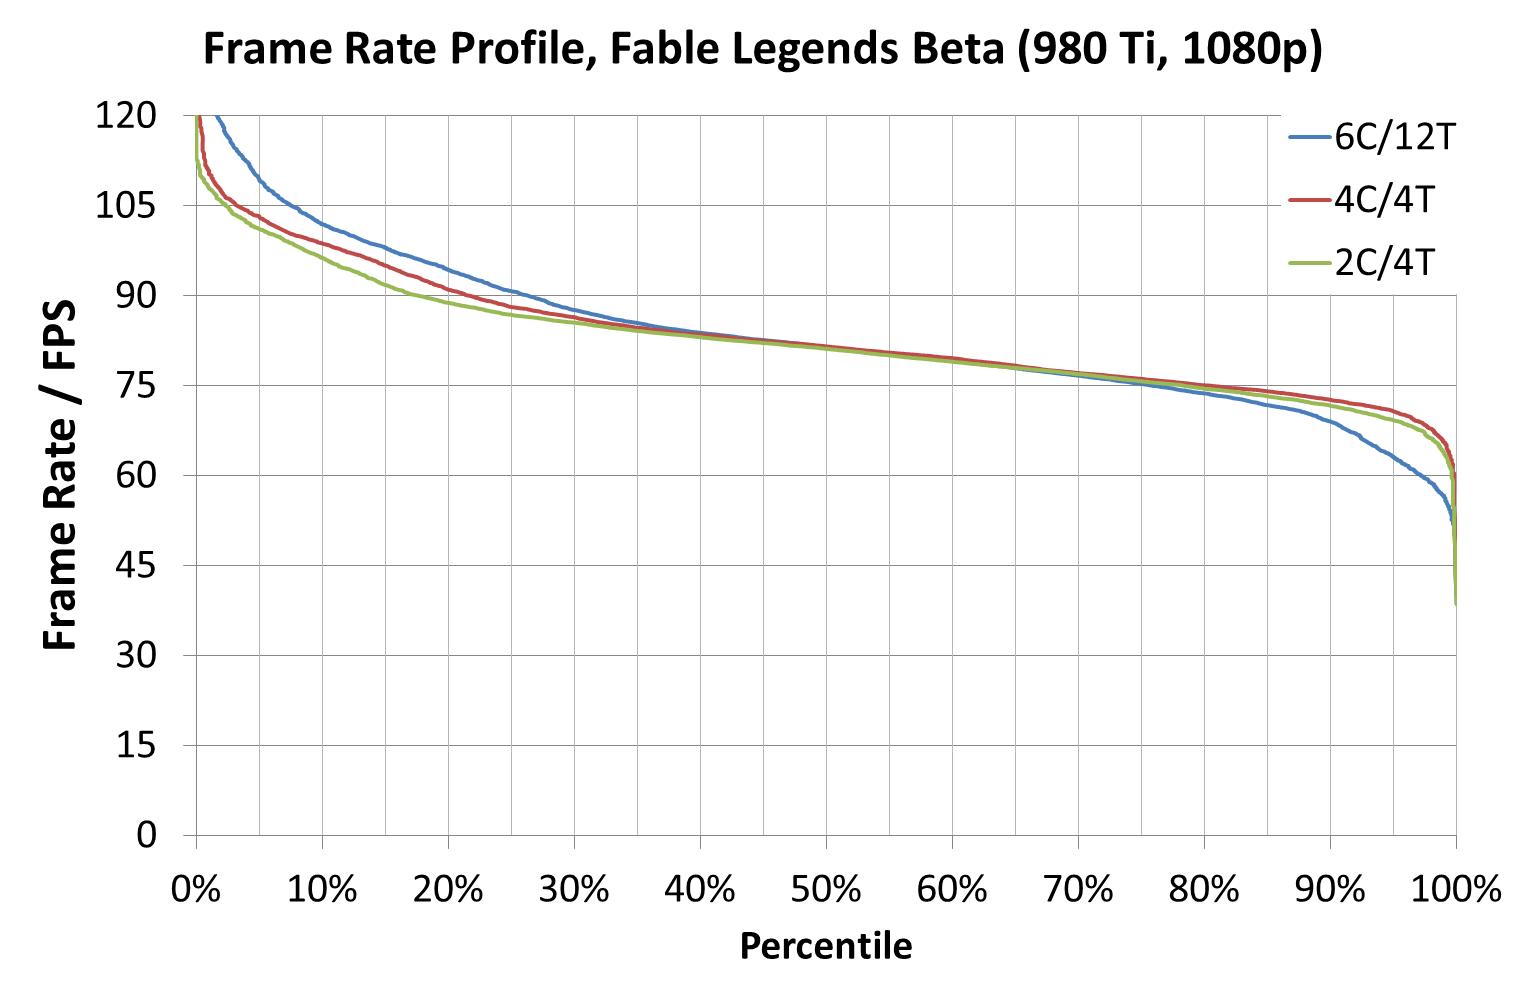
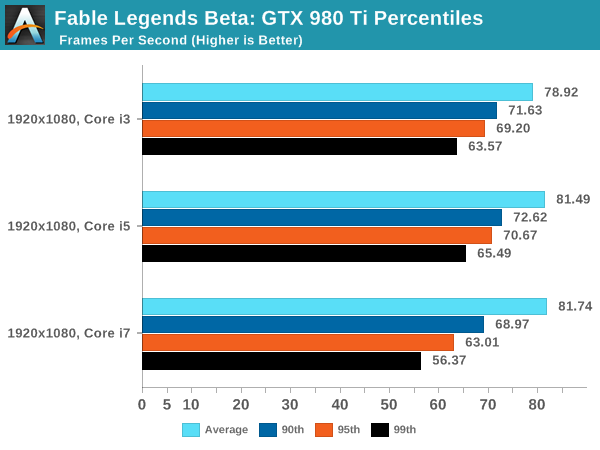
At 1080p, the Core i7 gives greater results when the frame rate is above the average and we see some scaling effects when the scenes are simple (giving high frame rates). But for whatever reason, when the going gets tough the i7 seems to bottom out as we go beyond the 80th percentile.
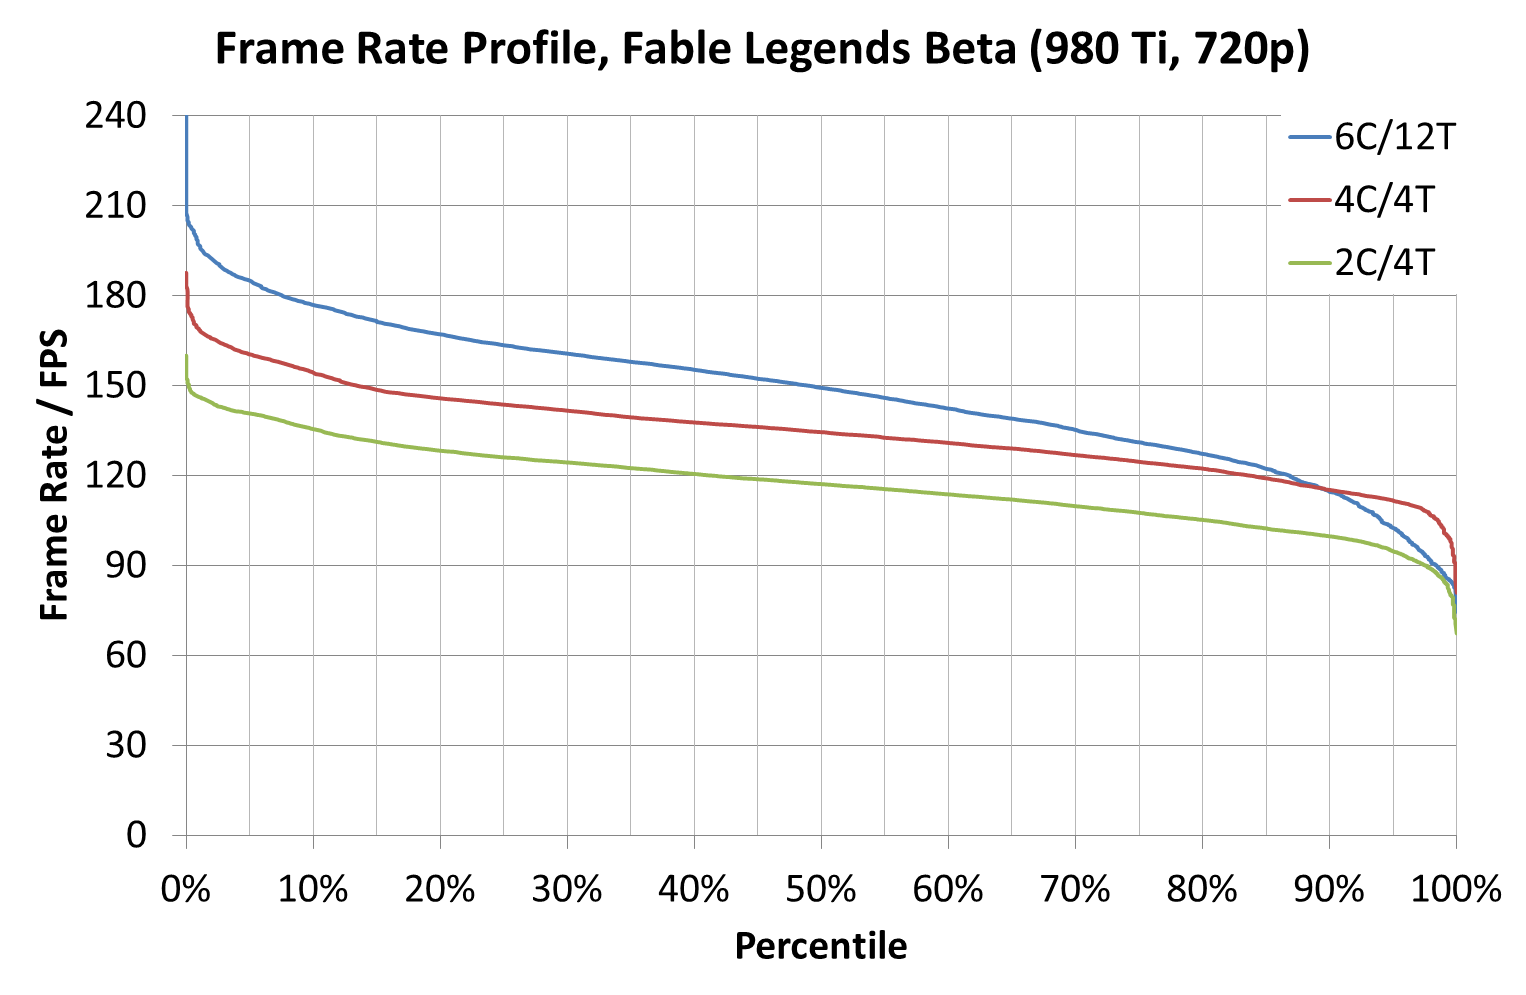
If we ever wanted to see a good representation of CPU scaling, the 720p graph is practically there – all except for the 85th percentile and up which makes the data points pulled out in this region perhaps unrepresentative of the whole. This issue might be the same issue when it comes to the 1080p results as well.


141 Comments
View All Comments
Jarrid Sinn - Wednesday, January 13, 2016 - link
It would be nice to see how the performance changes with an AMD processor, especially since there is such a dramatic change due to the processor used in these test. This is of course taking into account how often you stated that the number and arrangement of the CPU cores seemed to make an impact on the results.