The Intel Broadwell Review Part 2: Overclocking, IPC and Generational Analysis
by Ian Cutress on August 3, 2015 8:00 AM ESTLinux Performance
Built around several freely available benchmarks for Linux, Linux-Bench is a project spearheaded by Patrick at ServeTheHome to streamline about a dozen of these tests in a single neat package run via a set of three commands using an Ubuntu 11.04 LiveCD. These tests include fluid dynamics used by NASA, ray-tracing, OpenSSL, molecular modeling, and a scalable data structure server for web deployments. We run Linux-Bench and have chosen to report a select few of the tests that rely on CPU and DRAM speed.
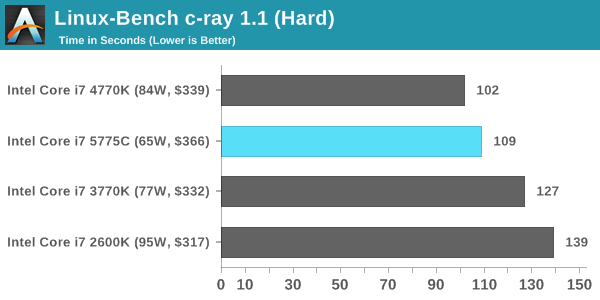
C-Ray: link
C-Ray is a simple ray-tracing program that focuses almost exclusively on processor performance rather than DRAM access. The test in Linux-Bench renders a heavy complex scene offering a large scalable scenario.
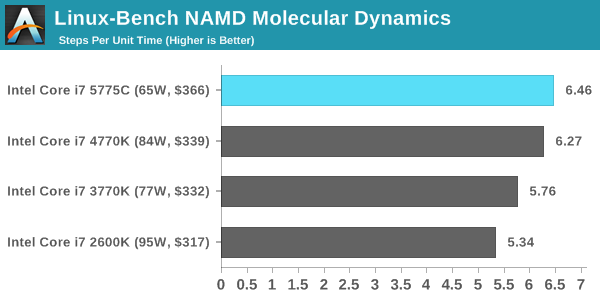
NAMD, Scalable Molecular Dynamics: link
Developed by the Theoretical and Computational Biophysics Group at the University of Illinois at Urbana-Champaign, NAMD is a set of parallel molecular dynamics codes for extreme parallelization up to and beyond 200,000 cores. The reference paper detailing NAMD has over 4000 citations, and our testing runs a small simulation where the calculation steps per unit time is the output vector.
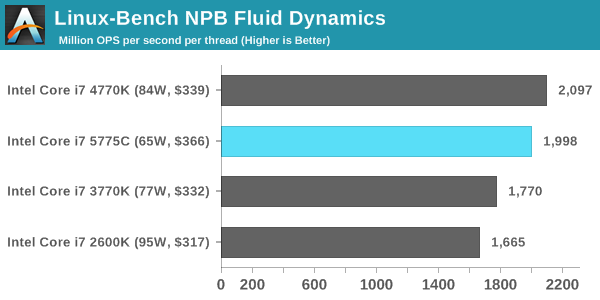
NPB, Fluid Dynamics: link
Aside from LINPACK, there are many other ways to benchmark supercomputers in terms of how effective they are for various types of mathematical processes. The NAS Parallel Benchmarks (NPB) are a set of small programs originally designed for NASA to test their supercomputers in terms of fluid dynamics simulations, useful for airflow reactions and design.
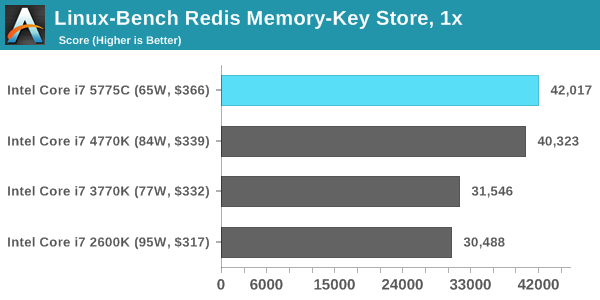
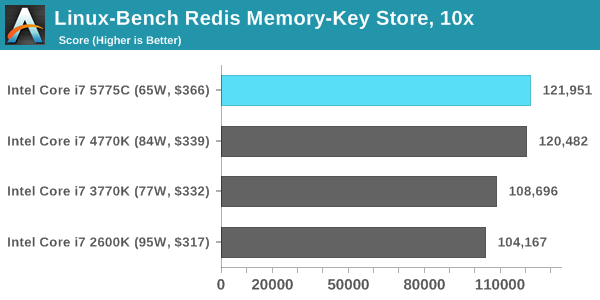
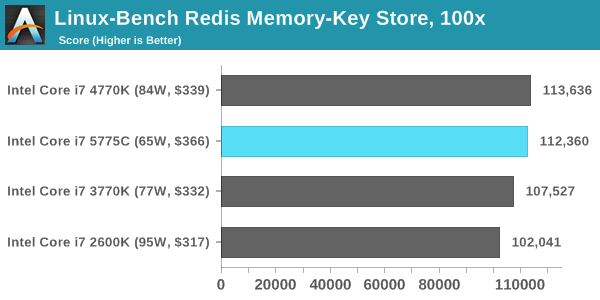
Redis: link
Many of the online applications rely on key-value caches and data structure servers to operate. Redis is an open-source, scalable web technology with a b developer base, but also relies heavily on memory bandwidth as well as CPU performance.


121 Comments
View All Comments
extide - Monday, August 3, 2015 - link
Actually, no the Author has it correct. The big die the che CPU/GPU, and the small one is the eDRAM.On the GT3 dies, Intel folds the graphics back across the CPU's, instead of having it as a very long rectangle.
See this: http://www.computershopper.com/var/ezwebin_site/st...
vs This: http://www.overclock.net/content/type/61/id/230657...
hansmuff - Monday, August 3, 2015 - link
Ian, Thank you for this excellent article. I have wished for a 2600k comparison to the more recent CPU iterations and one can piece some of it together here and there but this comprehensive view is outstanding! Still holding out for Skylake, then the 2600k might have to retire.Ewann - Monday, August 3, 2015 - link
I am really happy to see the i7-2600k comparison here. Like others who've commented, I'm still running that CPU- albeit at stock clock- and it's been totally stable with months on end of uptime (knock on wood). Sure, I've upgraded the GPU once or twice since 2011, but I can't see any reason to build a new system based on these benchmarks. The GPU (GTX 780) is still the limiting factor for gaming, and the 15-20% performance boost overall won't make a significant difference in my day-to-day usage. I now understand why Intel is struggling.Awesomeness - Monday, August 3, 2015 - link
Same here. I bought a 2600K in the first month it was out. After years of 24/7 operation at 4,9GHz it died. I replaced it with a $100 2500K that's running at 4,6GHz. SB for the win.nathanddrews - Monday, August 3, 2015 - link
OC benchmarks from each generation? I saw stock benchmarks and 3GHz benchmarks, but not benchmarks for Good or Great OC. I was expecting it based off of the title, but didn't see anything in the article.Staafk - Monday, August 3, 2015 - link
Missing OC performance comparisons. Or am I blind? The latter is quite possible tbh.Dribble - Monday, August 3, 2015 - link
Yes, that's what I thought. I want to see what they can all do at a good o/c. I don't run my cpu stock or at 3ghz, I want to see how my o/c sandy bridge would do against an o/c broadwell to see if it's worth an upgrade yet?Impulses - Monday, August 3, 2015 - link
You can typically extrapolate like 5% per 200MHz, tho it would've been nice to see indeed.joex4444 - Monday, August 3, 2015 - link
With the whole point of the article being that IPC goes up, this rule is really not suitable. If the IPC goes up by 20%, then if the previous generation followed the 5% per 200MHz rule the new generation follows either 6% per 200MHz or 5% per 167MHz. Though we'd really expect the instructions per second (IPS) to be the important part, and that's not dependent solely upon the size of the overclock, but the ratio of the overclock to stock. Jumping to 4.2GHz from 3.2GHz is a 31% gain, but going to 4.5GHz from 3.5GHz is a 29% gain despite both being a 1.0GHz overclock.With the typical IPC gain of 4.4%, we could roughly estimate that a Broadwell at 4.2GHz is like a Haswell at 4.4GHz. With 4.2GHz on Broadwell being a "Good OC" and 4.5GHz on Haswell being a "Good OC" we'd still expect Haswell to be faster once overclocked - but the review should be showing this. However if the particular program is making really good use of the eDRAM, then that 4.2GHz is akin to Haswell at 4.9GHz, which is beyond an excellent OC...
SirMaster - Monday, August 3, 2015 - link
Feelin' pretty good about my 4.6GHz 4770K that I bought more than 2 years ago heh.