The ASUS X99 Rampage V Extreme ROG Review
by Ian Cutress on June 22, 2015 8:45 AM EST- Posted in
- Motherboards
- Asus
- ROG
- Haswell-E
- X99
System Performance
Power Consumption
Power consumption was tested on the system while in a single MSI GTX 770 Lightning GPU configuration with a wall meter connected to the OCZ 1250W power supply. This power supply is Gold rated, and as I am in the UK on a 230-240 V supply, leads to ~75% efficiency > 50W, and 90%+ efficiency at 250W, suitable for both idle and multi-GPU loading. This method of power reading allows us to compare the power management of the UEFI and the board to supply components with power under load, and includes typical PSU losses due to efficiency. These are the real world values that consumers may expect from a typical system (minus the monitor) using this motherboard.
While this method for power measurement may not be ideal, and you feel these numbers are not representative due to the high wattage power supply being used (we use the same PSU to remain consistent over a series of reviews, and the fact that some boards on our test bed get tested with three or four high powered GPUs), the important point to take away is the relationship between the numbers. These boards are all under the same conditions, and thus the differences between them should be easy to spot.
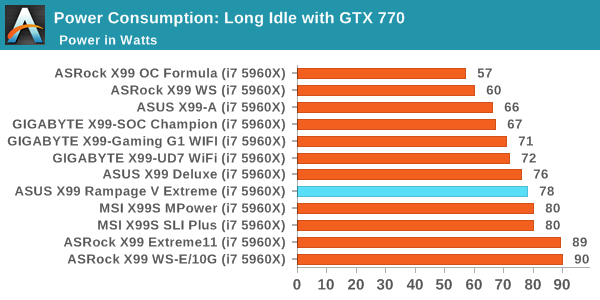
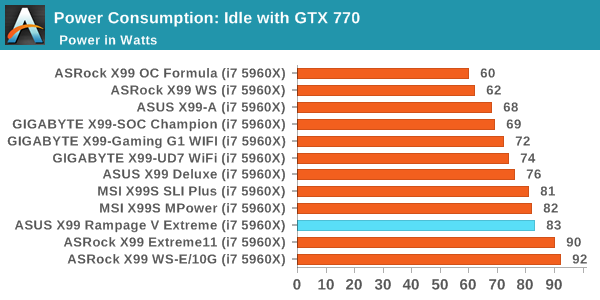
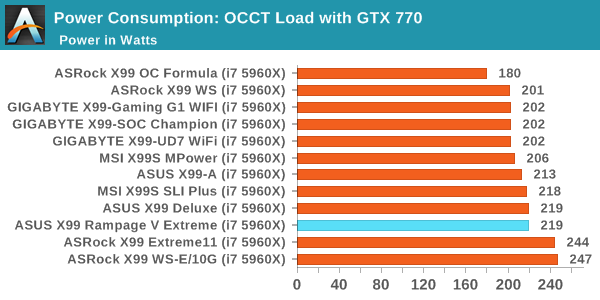
Power Consumption for X99 seems to hover around three points in our test – 200W, 220W and 240W. This puts the Rampage V Extreme in the middle, with similarly placed idle and long idle results.
Windows 7 POST Time
Different motherboards have different POST sequences before an operating system is initialized. A lot of this is dependent on the board itself, and POST boot time is determined by the controllers on board (and the sequence of how those extras are organized). As part of our testing, we look at the POST Boot Time using a stopwatch. This is the time from pressing the ON button on the computer to when Windows 7 starts loading. (We discount Windows loading as it is highly variable given Windows specific features.)
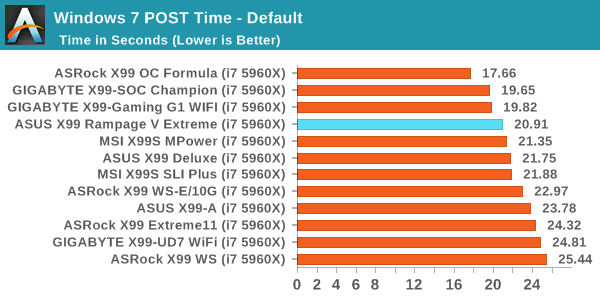

Typically the more hardware features we have, the longer the time to post. In this circumstance the Extreme does well, and the holy grail of 20 seconds for X99 is not too far away. One of the big issues with X99, as we mentioned earlier in the review, is that DRAM training can take up to 50% of this time but is a necessary part in order to ensure stability.
Rightmark Audio Analyzer 6.2.5
Rightmark:AA indicates how well the sound system is built and isolated from electrical interference (either internally or externally). For this test we connect the Line Out to the Line In using a short six inch 3.5mm to 3.5mm high-quality jack, turn the OS speaker volume to 100%, and run the Rightmark default test suite at 192 kHz, 24-bit. The OS is tuned to 192 kHz/24-bit input and output, and the Line-In volume is adjusted until we have the best RMAA value in the mini-pretest. We look specifically at the Dynamic Range of the audio codec used on board, as well as the Total Harmonic Distortion + Noise.
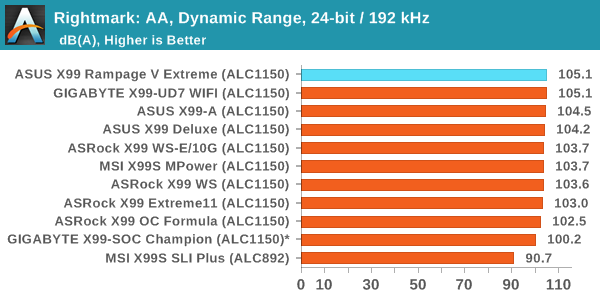
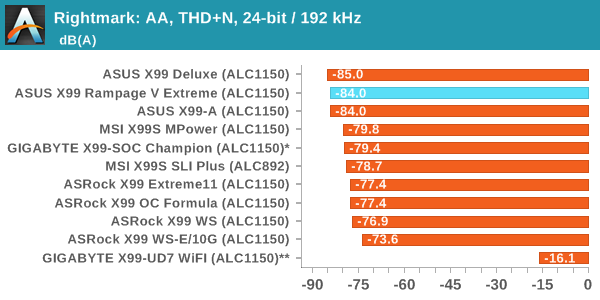
Similar to the X99 Deluxe, the Extreme performs very well here.
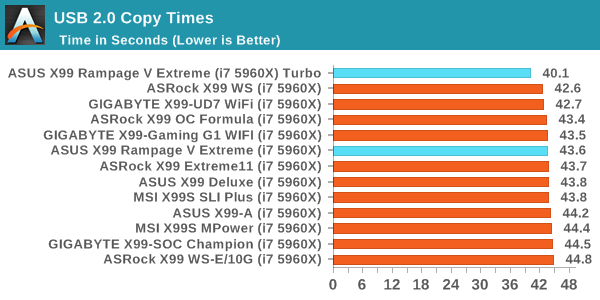
USB Backup
For this benchmark, we transfer a set size of files from the SSD to the USB drive using DiskBench, which monitors the time taken to transfer. The files transferred are a 1.52 GB set of 2867 files across 320 folders – 95% of these files are small typical website files, and the rest (90% of the size) are small 30 second HD videos. In an update to pre-Z87 testing, we also run MaxCPU to load up one of the threads during the test which improves general performance up to 15% by causing all the internal pathways to run at full speed.
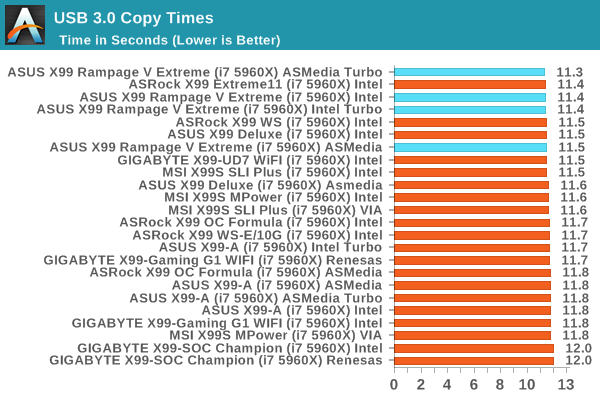
All of our USB 3.0 results have hovered between 11.4 and 12.0 with a couple of outliers, so it is good to see an 11.4 second result.
DPC Latency
Deferred Procedure Call latency is a way in which Windows handles interrupt servicing. In order to wait for a processor to acknowledge the request, the system will queue all interrupt requests by priority. Critical interrupts will be handled as soon as possible, whereas lesser priority requests such as audio will be further down the line. If the audio device requires data, it will have to wait until the request is processed before the buffer is filled.
If the device drivers of higher priority components in a system are poorly implemented, this can cause delays in request scheduling and process time. This can lead to an empty audio buffer and characteristic audible pauses, pops and clicks. The DPC latency checker measures how much time is taken processing DPCs from driver invocation. The lower the value will result in better audio transfer at smaller buffer sizes. Results are measured in microseconds.
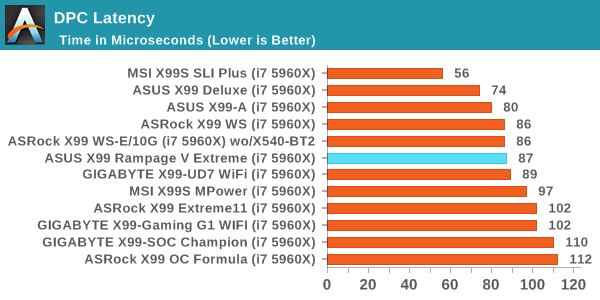
Under 100 microseconds. Tick.


41 Comments
View All Comments
Malahmen - Friday, January 27, 2017 - link
I would like to warn you on this one.You can't even run a single GPU + a m.2 on that board with a 5820k because it has 28 lanes.
The board disables the 4th PCIe slot, which is shared with the m.2 slot, so no m.2 slot as soon as the bios takes over.
bottom line, you might boot from a pen drive, start to install your SO on the ssd, but after restarting, the bios wont detect the ssd (so you wont be able to select it as boot drive) because detecting your cpu, the board will shut the 4th PCIe (and your m.2 slot).
You might be able to do that with a 5930k though.