Intel SSD 750 PCIe SSD Review: NVMe for the Client
by Kristian Vättö on April 2, 2015 12:00 PM ESTMixed Random Read/Write Performance
Mixed read/write tests are also a new addition to our test suite. In real world applications a significant portion of workloads are mixed, meaning that there are both read and write IOs. Our Storage Bench benchmarks already illustrate mixed workloads by being based on actual real world IO traces, but until now we haven't had a proper synthetic way to measure mixed performance.
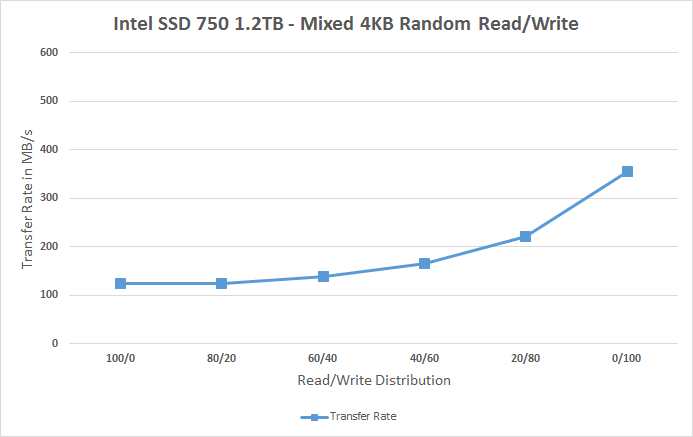
The benchmark is divided into two tests. The first one tests mixed performance with 4KB random IOs at six different read/write distributions starting at 100% reads and adding 20% of writes in each phase. Because we are dealing with a mixed workload that contains reads, the drive is first filled with 128KB sequential data to ensure valid results. Similarly, because the IO pattern is random, I've limited the LBA span to 16GB to ensure that the results aren't affected by IO consistency. The queue depth of the 4KB random test is three.
Again, for the sake of readability, I provide both an average based bar graph as well as a line graph with the full data on it. The bar graph represents an average of all six read/write distribution data rates for quick comparison, whereas the line graph includes a separate data point for each tested distribution.
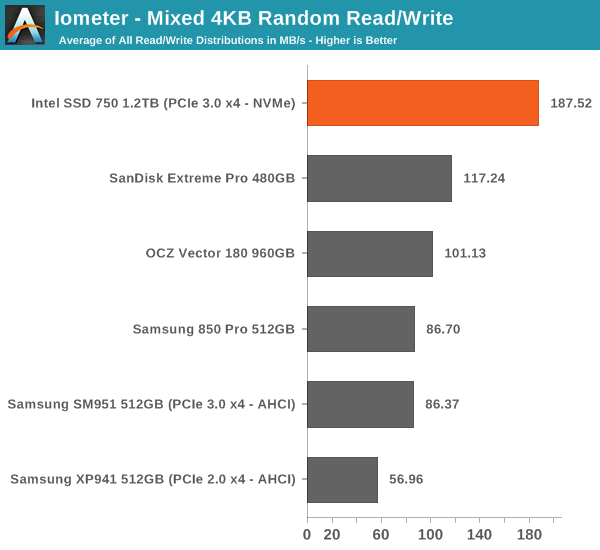
The SSD 750 does very well in mixed random workloads, especially when compared to the SM951 that is slower than most high-end SATA drives. The performance scales quite nicely as the portion of writes is increased.
 |
|||||||||
Mixed Sequential Read/Write Performance
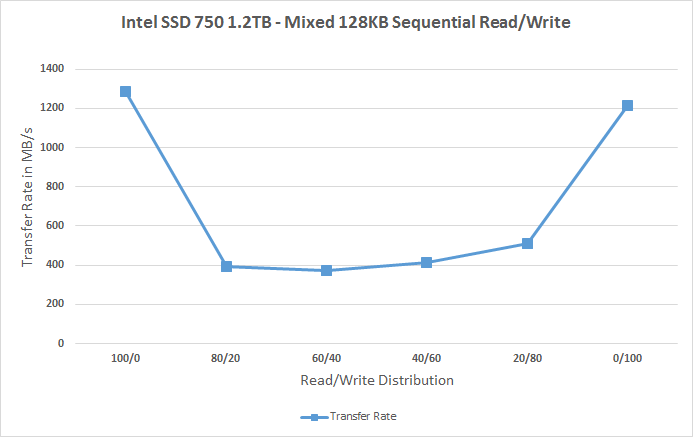
The sequential mixed workload tests are also tested with a full drive, but I've not limited the LBA range as that's not needed with sequential data patterns. The queue depth for the tests is one.
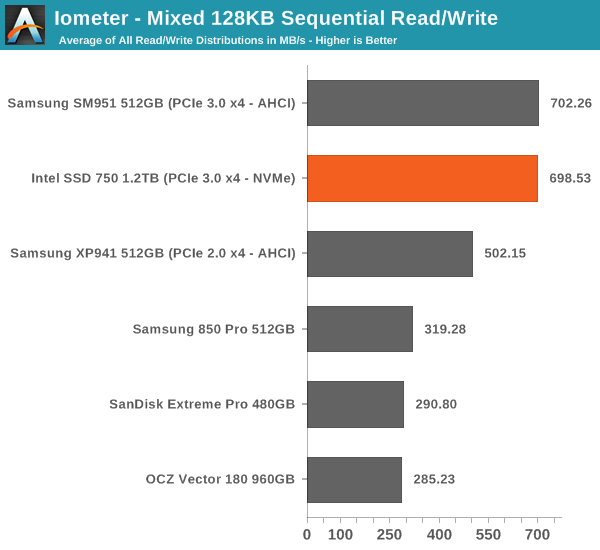
In mixed sequential workloads, however, the SSD 750 and SM951 are practically indentical. Both deliver excellent performance at 100% reads and writes, but the performance does drop significantly once reads and writes are mixed. Even with the drop, the two push out 400MB/s whereas most SATA drives manage ~200MB/s, so PCIe certainly has a big advantage here.
 |
|||||||||


132 Comments
View All Comments
knweiss - Thursday, April 2, 2015 - link
According to Semiaccurate the 400 GB drive has "only" 512 MB DRAM.(Unfortunately, ARK hasn't been updated yet so I can't verify.)
eddieobscurant - Thursday, April 2, 2015 - link
You're right it's probably 512mb for the 400gb model and 1gb for the 1.2tb modelAzunia - Thursday, April 2, 2015 - link
In PCPer's review of this drive, they actually talk about the problems of benchmarking this drive. (https://www.youtube.com/watch?v=ubxgTBqgXV8)Seems like some benchmarks like Iometer cannot actually feed the drive, due to being programmed with a single thread. Have you had similar experiences during benchmarking, or is their logic faulty?
Kristian Vättö - Friday, April 3, 2015 - link
I didn't notice anything that would suggest a problem with Iometer's capability of saturating the drive. In fact, Intel provided us Iometer benchmarking guidelines for the review, although they didn't really differ from what I've been doing for a while now.Azunia - Friday, April 3, 2015 - link
Reread their article and it seems like the only problem is the Iometer's Fileserver IOPS Test, which peaks at around 200.000 IOPS, since you don't use that one thats probably the reason why you saw no problem.Gigaplex - Thursday, April 2, 2015 - link
"so if you were to put two SSD 750s in RAID 0 the only option would be to use software RAID. That in turn will render the volume unbootable"It's incredibly easy to use software RAID in Linux on the boot drives. Not all software RAID implementations are as limiting as Windows.
PubFiction - Friday, April 3, 2015 - link
"For better readability, I now provide bar graphs with the first one being an average IOPS of the last 400 seconds and the second graph displaying the standard deviation during the same period"lol why not just portray standard deviation as error bars like they are supposed to be shown. Kudos for being one of the few sites to recognize this but what a convoluted senseless way of showing them.
Chloiber - Friday, April 3, 2015 - link
I think the practical tests of many other reviews show that the normal consumer has absolutely no benefit (except being able to copy files faster) from such an SSD. We have reached the peak a long time ago. SSDs are not the limiting factor anymore.Still, it's great to see that we finally again major improvements. It was always sad that all SSDs got limited by the interface. This was the case with SATA 2, it's the case with SATA 3.
akdj - Friday, April 3, 2015 - link
Thanks for sharing KristianQuery about the thorough put using these on external Thunderbolt docks and PCIe 'decks' (several new third party drive and GPU enclosires experimenting with the latter ...and adding powerful desktop cards {GPU} etc) ... Would there still be the 'bottle neck' (not that SLI nor Crossfire with the exception of the MacPro and how the two AMDs work together--would be a concern in OS X but Windows motherboards...) if you were to utilize the TBolt headers to the PCIe lane-->CPU? These seem like a better idea than external video cards for what I'm Doing on the rMBPs. The GPUs are quick enough, especially in tandem with the IrisPro and its ability to 'calculate' ;) -- but a 2.4GB twin card RAID external box with a 'one cord' plug hot or cold would be SWEEET,
wyewye - Friday, April 3, 2015 - link
Kristian: test with QD128, moron, its NVM.Anandtech becomes more and more idiotic: poor articles and crappy hosting, you have to real pages multiple times to access anything.
Go look at TSSDreview for a competent review.