Intel NUC5i5RYK Review: A Broadwell-U UCFF PC for Enthusiasts
by Ganesh T S on February 20, 2015 8:00 AM ESTPower Consumption and Thermal Performance
The power consumption at the wall was measured with a 1080p display being driven through the HDMI port. In the graphs below, we compare the idle and load power of the Intel NUC5i5RYK (Enthusiast) with other low power PCs evaluated before. For load power consumption, we ran Furmark 1.12.0 and Prime95 v27.9 together. The numbers are not beyond the realm of reason for the combination of hardware components in the machine.
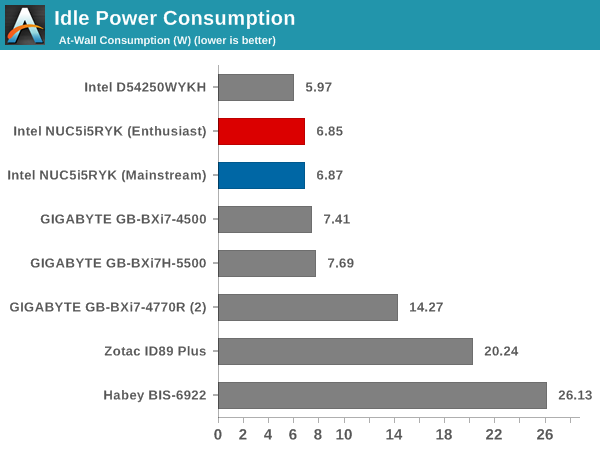
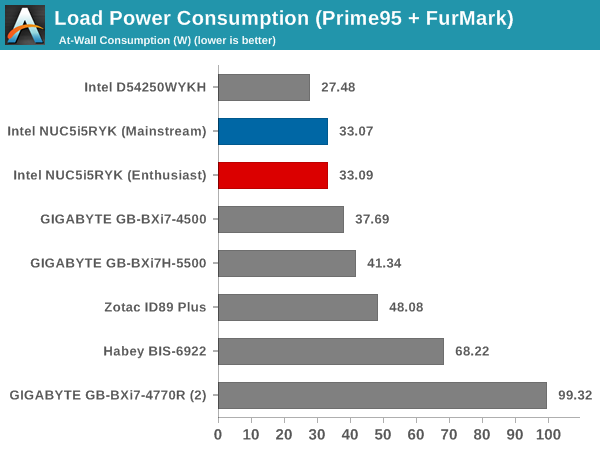
By default, the BIOS puts the unit in the maximum power consumption / performance mode. The above numbers are with those default settings. It is possible for the end-user to drive down the numbers further with tweaks in the BIOS (at the cost of performance)
In terms of thermal design, the NUC5i5RYK is no different from the Haswell NUC. There are ventilation slots on the side and a small fan directly beneath the lid helps draw in air over the heatsink that is placed behind the slots. On the other side, the lid has a thermal protection strip adhered to it such that it gets placed directly over the M.2 SSD. This ensures proper cooling for the storage media (an issue that one of the previous generation NUCs faced). In order to evaluate the thermal performance, we started with the system at idle, followed by 30 minutes of pure CPU loading. This was followed by another 30 minutes of both CPU and GPU being loaded simultaneously. After this, the CPU load was removed, allowing the GPU to be loaded alone for another 30 minutes.
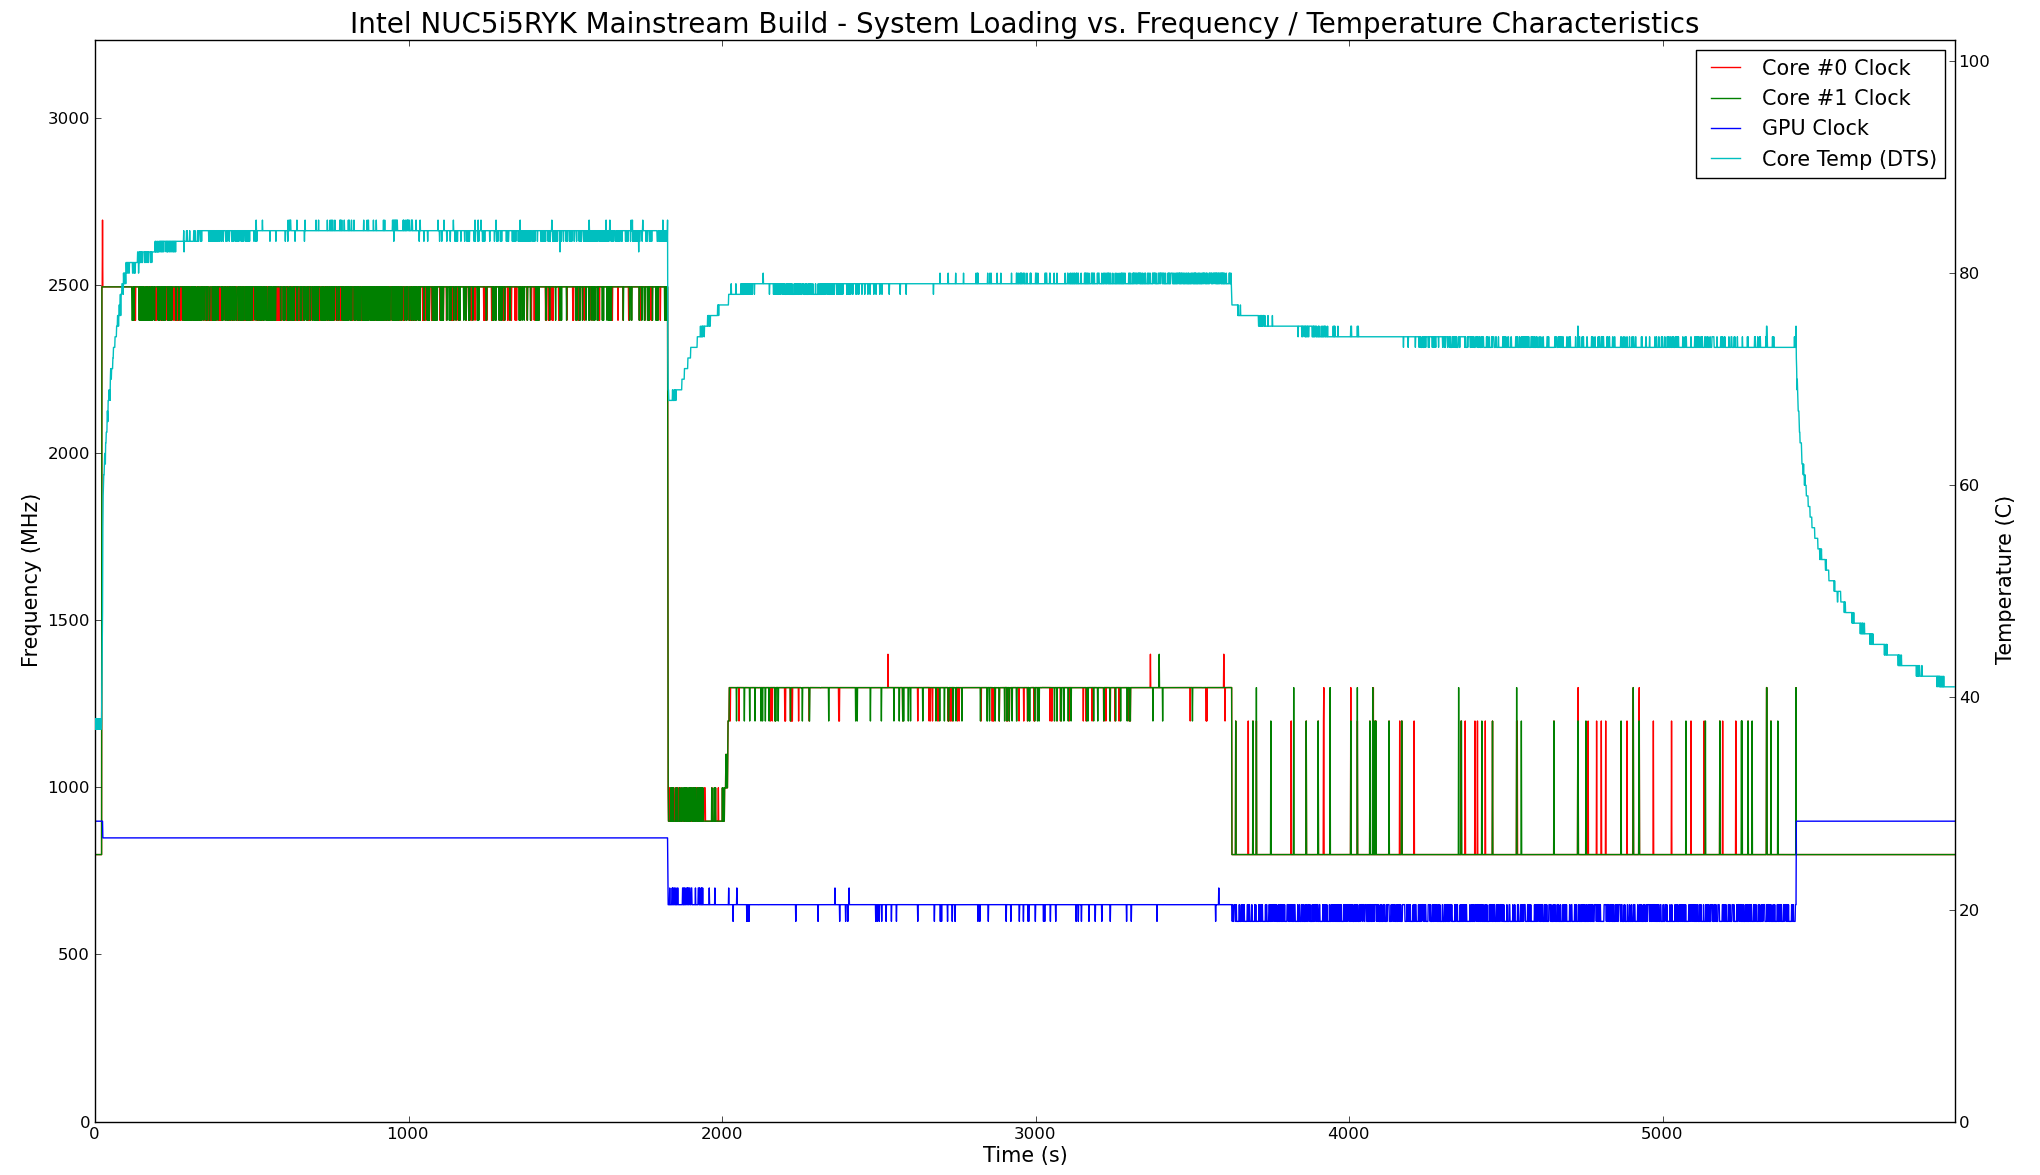
In the pure CPU loading scenario, the cpre frequencies stay well above the suggested base value of 1.6 GHz, thanks to the BIOS setting controlling the maximum allowed sustained power consumption. The turbo burst frequency of 2.7 GHz is observed only very briefly, and the cores settle down to between 2.4 and 2.5 GHz. We see the temperature stabilizing slightly above 80 C (despite the junction temperature being 105 C). On the other hand, when the CPU and GPU are both loaded, the frequencies drop down to around 1.3 GHz for the cores. The GPU is advertised to run at a base clock of 300 MHz, with a turbo mode of 950 MHz. The actual frequency stays above 700 MHz comfortably throughout our stress test. In the absence of any CPU load, the cores drop down to 800 MHz. The temperatures are also below 80 C throughout the time that the GPU is loaded up. The behavior of the clocks is similar to what we observed for the GIGABYTE Broadwell BRIX s.
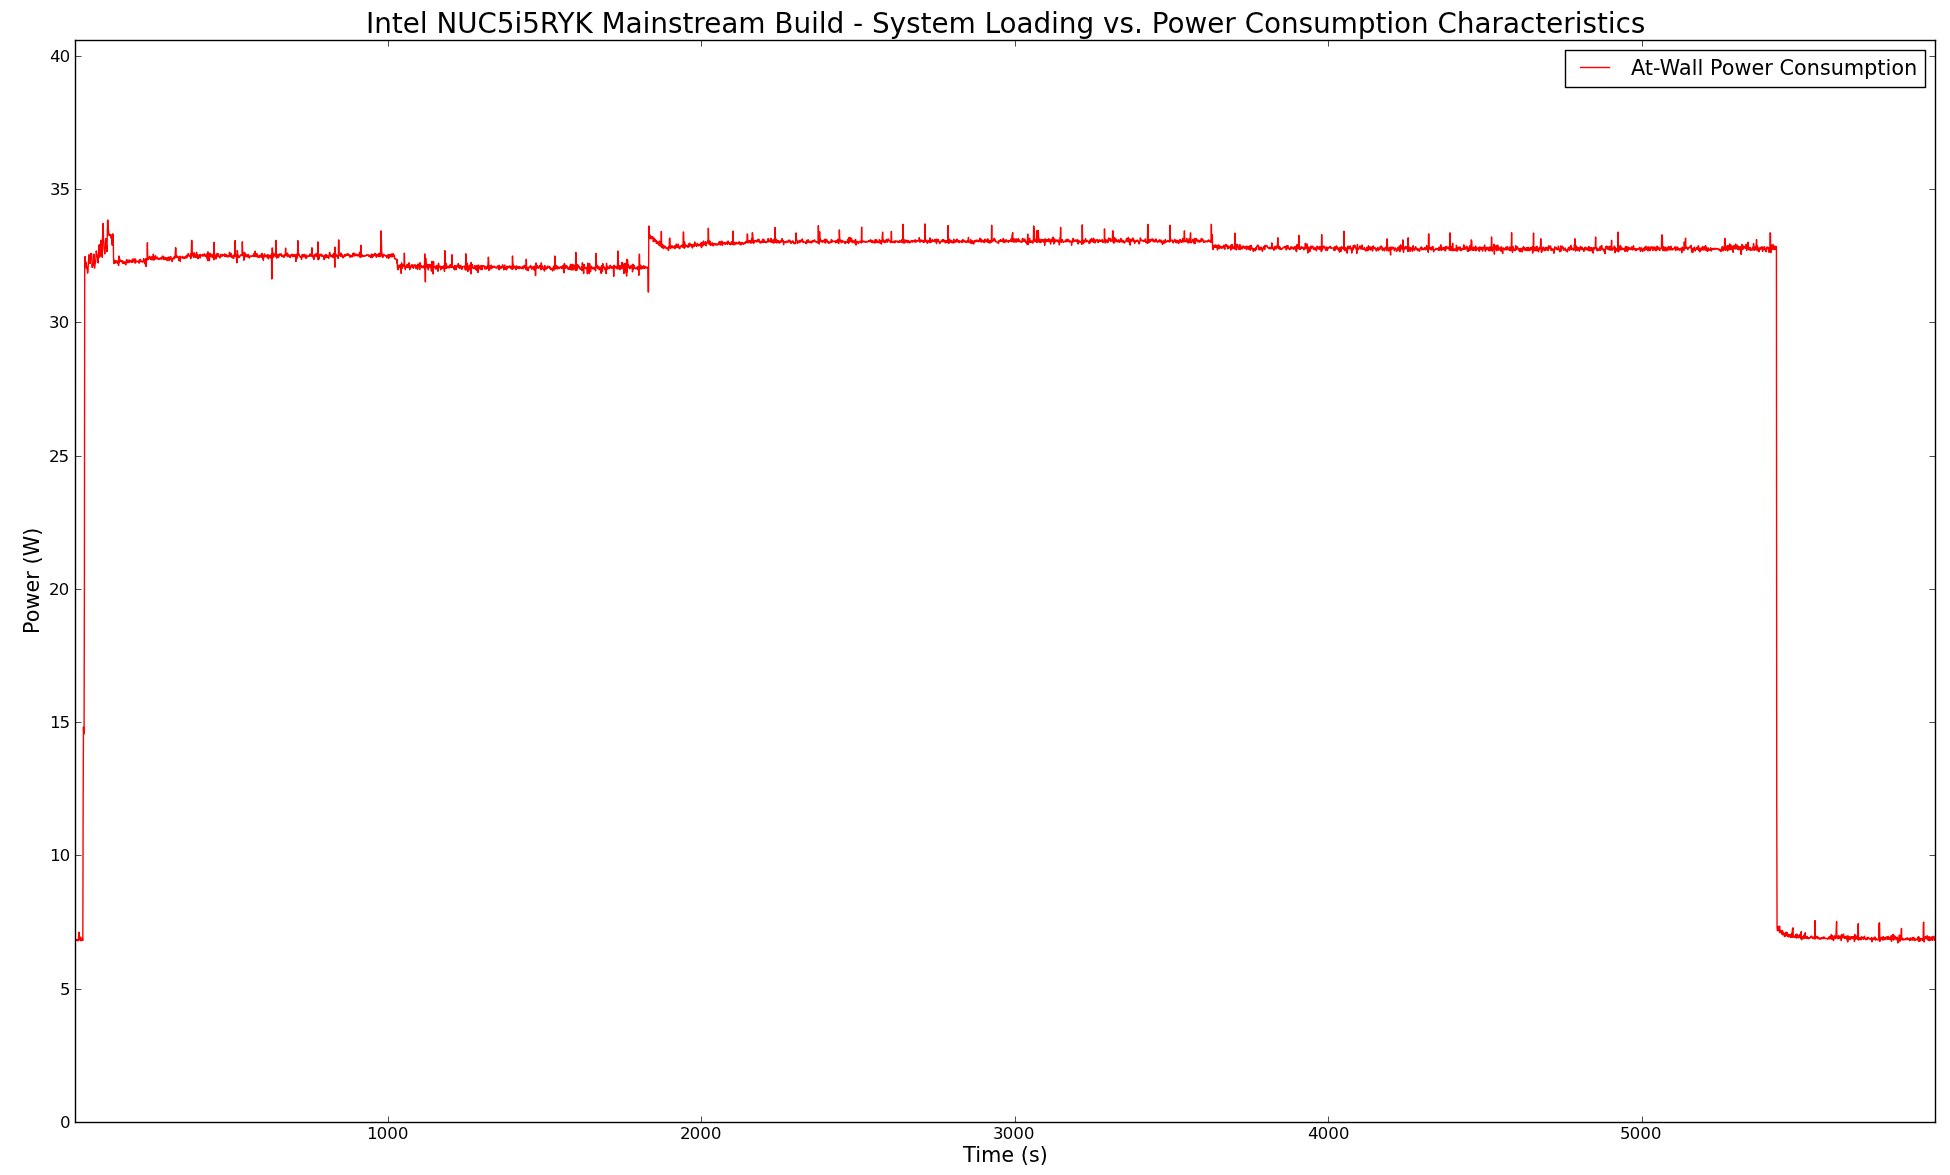
The above graph presents the power consumption at the wall during the above thermal stress run. This shows that Intel has designed the NUC with a certain maximum power budget in mind, and the clocks of the CPU and GPU are adjusted depending on the load to obey that configurable TDP. One interesting aspect is that the GPU clock at idle is always reported to be 900 MHz by various tools. We assume there is some sort of inner clock-gating going on beyond the observation point. Otherwise, it is possible to drive down the idle power consumption even further. The thermal performance of the enthusiast build was along the same lines, with a cap of around 34 W for the maximum power consumption at the wall.
All in all, the thermal solution is very effective. Given that the acoustic side-effects were not irksome (subjectively) and the temperature of the CPU package was well under the junction temperature limits, we wonder if Intel has missed a trick by dialing down the overclocking and not allowing the full performance potential of the system to come through with the default BIOS settings.


83 Comments
View All Comments
smegforbrain - Saturday, February 21, 2015 - link
Agreed. We initially bought a D34010WYKH1 (i3) at work as a test device last summer to see how well they worked. A couple of our employees have been using them for more than 6 months now.I ended up buying a D54250WYKH1 (i5) for myself to use at home as a media PC and other uses. I'm very happy with it, but I am slightly disappointed that they didn't go with full HDMI for the Broadwell refresh.
mavere - Friday, February 20, 2015 - link
VP9 hybrid acceleration is enabled in recent Intel Broadwell drivers, and apparently Chrome 41+ (currently in Beta) has the ability to hook into Intel's VP9 decoder.In future Broadwell tests, can you check Youtube power consumption with Chrome 41+? Chrome defaults to VP9 on so most Youtube videos nowadays, so this is an important and unexplored area for mobile power usage.
TrackSmart - Friday, February 20, 2015 - link
I don't much of a performance difference between the "mainstream" and the "enthusiast" versions used in this article (aside for artificial SSD benchmarks). Of course, the price difference between the configurations is only $66.Really the biggest performance difference among all of the candidates is between the one machine that has a spinning hard disk and all of the rest. Worth knowing none-the-less.
Essence_of_War - Friday, February 20, 2015 - link
Should I be getting the message that intel not want us to use thunderbolt?Jaybus - Saturday, February 21, 2015 - link
No. It is a matter of power. Thunderbolt standard specifies that every port supply 10 W of DC power. Also, the controller itself is very high bandwidth and requires > 2 W. It adds up on a system striving to be low power and fanless.Samus - Friday, February 20, 2015 - link
Wow Intel has the cleanest uefi bios interface I've ever seen. Shame they don't make motherboards anymore :(A4i - Saturday, February 21, 2015 - link
I got the old i5-4200U , mounted on industrial PC chassis (half inch thick aluminum side panel/radiator). It gets extremely hot, when operating at max CPU load (and ~0 GPU load). Don't hold you breath for power efficiency and productivity. Also that platform lacks any overclocking settings in BIOS or OS tools and is frustratingly painful to undervolt.KAlmquist - Saturday, February 21, 2015 - link
A benchmark question:The "enthusiast" version has 10-10-10-32 1866Mhz memory, while the "mainstream" version has 9-9-9-27 1600Mhz memory. So the difference in memory could account for at most a 17% difference in performance between the two versions (1866Mhz/1600Mhz). But the Cinebench R15 3D rendering multi-threaded benchmark shows the "enthusiast" version to be 34% faster, and the 7-Zip LZMA Decompression benchmark makes the "enthusiast" version 30% faster.
The only other difference between the two versions is the choice of SSD. This could in principle explain the differences listed above, but that would mean that the two benchmarks cited are largely disk I/O bound since we see the effect even with relatively fast disk drives (SSD rather than mechanical) and a relatively slow CPU (1.6 Ghz dual core). I thought those benchmarks were intended to measure computational throughput, and thus should not be affected by the storage subsystem at all. Am I wrong?
Kidster3001 - Friday, February 27, 2015 - link
If you're looking for a pur CPU benchmark that doesn't rely on other parts of teh system then you'll end up with synthetics that everyone complains about because they don't reflect the real world.Yes, Archive applications rely very heavily on I/O. If you want to use them for CPU benchmarks you should set up RAM Disks for the storage.
On a similar note, one of my pet peeves is using browser benchmarks to compare CPUs. Browser benchmarks measure the performance of the browser and it''s engine(s). They do very little good as a CPU comparison tool. Sunspider for instance can score wildly different on the exact same system just by using a different browser.
gfieldew - Saturday, February 21, 2015 - link
Could the FHD model drive a 4K TV/Monitor adequately? I'm not expecting HDMI 2.0 but 60Hz would be good. Thank-you!