The Google Nexus 9 Review
by Joshua Ho & Ryan Smith on February 4, 2015 8:00 AM EST- Posted in
- Tablets
- HTC
- Project Denver
- Android
- Mobile
- NVIDIA
- Nexus 9
- Lollipop
- Android 5.0
Battery Life
It goes without saying that battery life is one of the most important aspects of a mobile device. After all, a mobile device isn’t really mobile if it can only be used for an hour before running out of battery. In order to test this, we turn to our standard suite of battery life tests, which include our web browser battery life test, along with some compute-bound benchmarks to characterize battery life across various use cases.
However, as the Nexus 9 introduces such a unique CPU architecture, I felt that it was necessary to try and adequately capture the full extent of battery life. To this end, I’ve introduced a new test that is really quite simple but important, as we can start to separate display power from everything else since it can often be the single largest consumer of power in a test. In order to do this, everything that could run during a test is disabled, and the device is placed in airplane mode with the display at 200 nits. A white image is displayed on the screen from a full charge until the device shuts down.
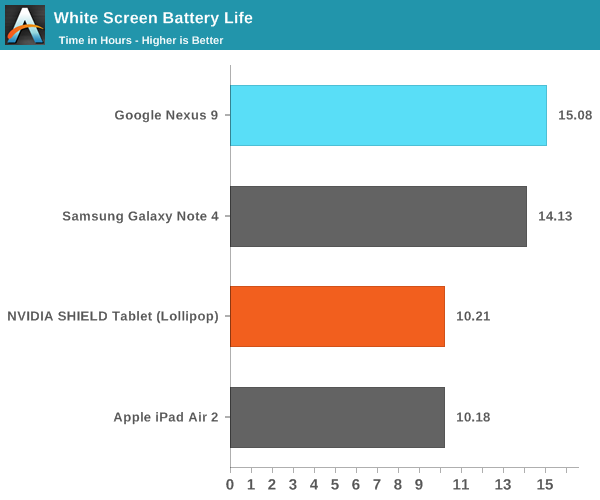
Interestingly enough, the display runtime on the Nexus 9 is about as good as it gets when compared to other devices for which we have data. I suspect we’re looking at the direct result of the large battery combined with an efficient display, as the Nexus 9 can last as long as 15 hours in this test compared to the iPad Air 2’s 10 hours.
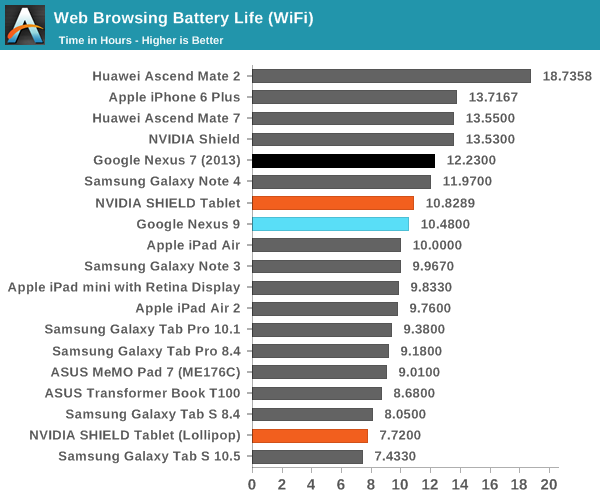
Unfortunately, the massive lead that we saw with the pure display test is significantly eroded in our web browser test. Our web test is primarily focused upon CPU, connectivity, and display efficiency. Seeing as how the Nexus 9’s display is far ahead of the iPad Air 2 and connectivity should be broadly similar in power efficiency, it seems that all of the efficiency gains from the display have gone into powering the Denver CPUs. It’s likely that process has a significant effect on this, so the more valid comparison is between SHIELD Tablet and the Nexus 9. At any rate, the Nexus 9 does manage to deliver solid battery life performance in this test which is definitely a good thing.
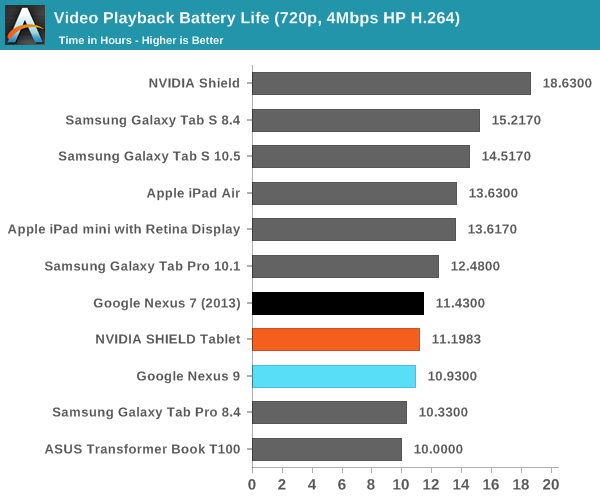
When we move to our pure video test, the Nexus 9 does have a minor regression when compared to the Nexus 7 (2013) and SHIELD Tablet. In this case, the AMOLED displays on the Galaxy Tab S line make for an easy victory due to the relatively high amount of black displayed in the content. The gap is closed between the two devices though, due to a reduced focus on SoC power.
While our web browsing test can give some idea of efficiency, there are often cases where more compute is directly used to support a better experience. To try and test for these compute-bound cases, we use Basemark OS II’s CPU battery life test and GFXBench’s T-Rex rundown for a GPU battery life test. As with the web browsing tests, these are run at 200 nits to keep things relatively equal.
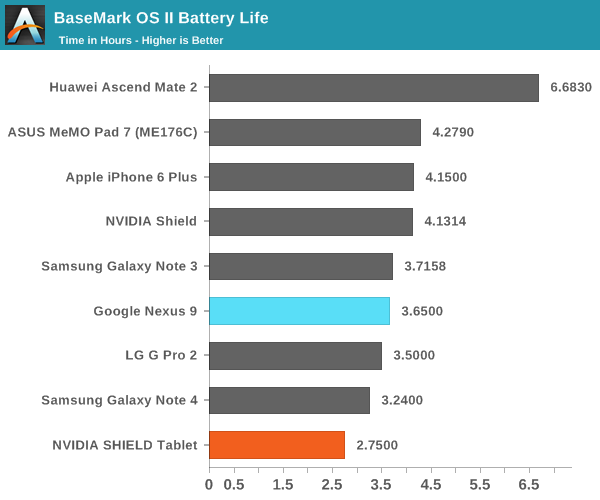
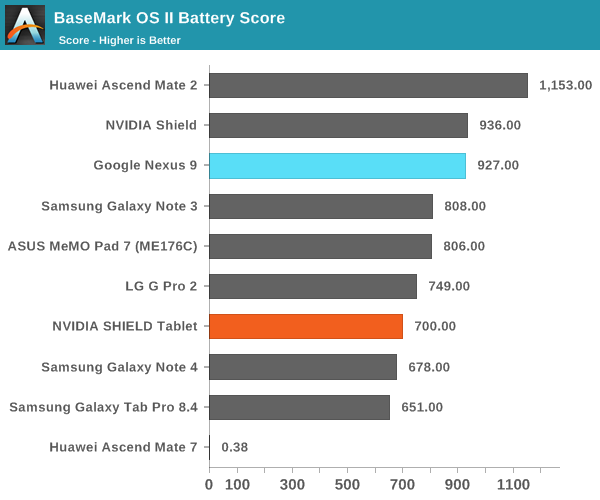
In Basemark OS II, the Nexus 9 does a surprisingly good job as the CPU manages to keep incredibly high sustained performance. The large battery and efficient display seem to help to a significant extent.
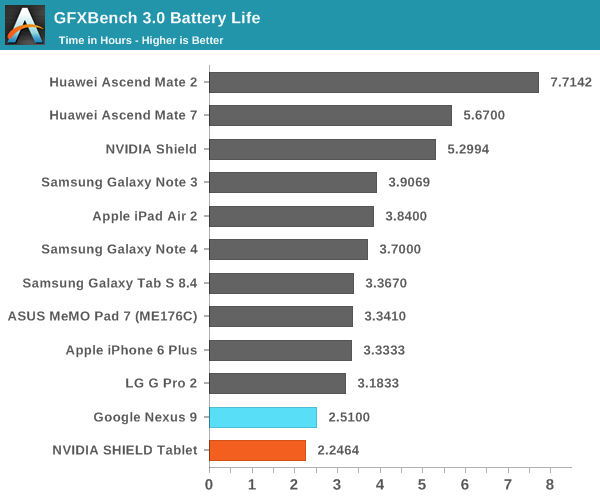
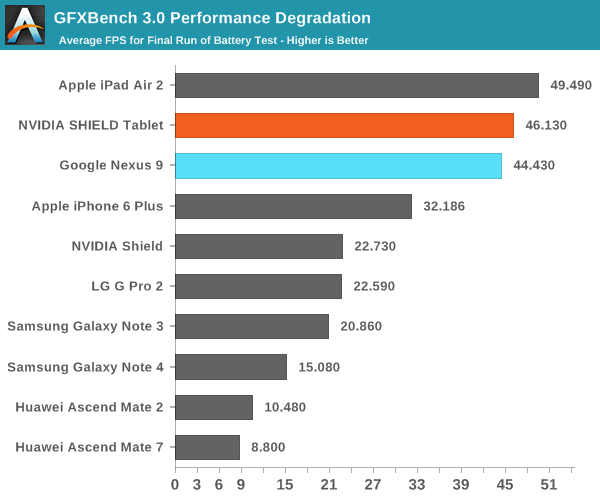
In GFXBench, it seems that not much changes overall. The GPU is definitely more power hungry than the PowerVR Series 6XT line-up and sustained performance is noticeably worse, but it’s in line with the SHIELD Tablet. End of run performance ends up a bit lower, but higher than one might expect. This is likely due to differing ambient temperatures. In practice, skin temperatures are about 45C in this test and localized to the top half of the device, and it’s likely that internal temperatures are around 80C as well. Seeing as how Tegra K1 can theoretically draw 33W in platforms such as the Jetson TK1 dev board with active cooling, it's incredibly impressive to see NVIDIA effectively keep such a powerful SoC within the constraints of a passively-cooled tablet.
Charge Time
While battery life is one part of the equation, charge time is an equally important aspect of overall battery life. To measure this, we measure the time from when charging begins to when the device reaches 100% charge. This is confirmed by taking measurements at the power outlet to make sure that power draw is below a certain level.
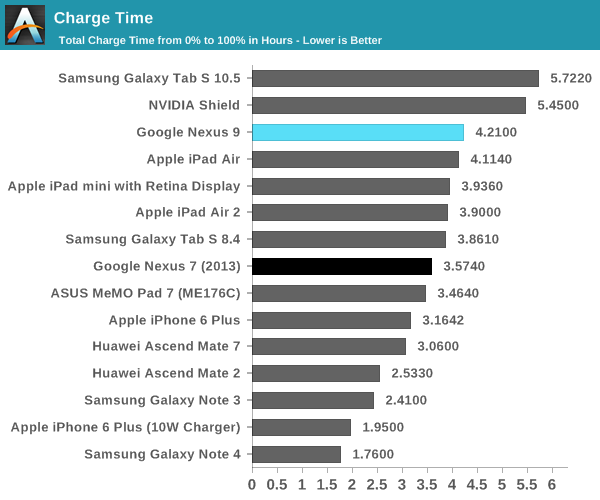
In this regard, the Nexus 9 is merely average for a tablet, although it does fall behind the competition as it uses a 5V, 1.5A charger for 7.5W instead of the 12-15W chargers that we’ve seen recently. It shouldn’t be a big issue, but in general this does mean that devices like the Galaxy Note 4 are actually better at battery life overall when compared to most tablets.


169 Comments
View All Comments
PC Perv - Wednesday, February 4, 2015 - link
It is clear, even though you did not say, why no one other than NV and Google will use Denver in their products. Thank you for the coherent review, Ryan.P.S. I can't wait for the day SunSpider, Basemark, and WebXPRT disappear from your benchmark suit.
jjj - Wednesday, February 4, 2015 - link
You always make those kind of claims about dual core vs more cores but you have never attempted to back them up with real world perf and power testing.In real use there are alerts and chats and maybe music playing and so on. While your hypothesis could be valid or partially valid you absolutely need to first verify it before heavily insisting on it and accepting it as true. Subjective conclusions are just not your style is it, you test things to get to objective results.
And it wold be easy you already have "clean"numbers and you would just need to run the same benchmarks for perf and power with some simulated background activity to be able to compare the differences in gains/loses.
PC Perv - Wednesday, February 4, 2015 - link
Where would you put the performance of "backup" ARM-only part of Denver? Cortex-A7? Is it measurable at all?Also, why don't Samsung use F2FS for their devices? I thought it was developed by them.
abufrejoval - Wednesday, February 4, 2015 - link
While the principal designer seems to be a Korean, I'm not sure he works for Samsung, who typically used Yet Another Flash File System (YAFFS).Ryan Smith - Wednesday, February 4, 2015 - link
It's not measurable in a traditional sense, as the DCO will kick in at some point. However I'd say it's somewhere along the lines of A53, though overall a bit better.Shadowmaster625 - Wednesday, February 4, 2015 - link
The design philosophy of the DCO does make a lot of sense. When your mobile device starts to bog down and you start cursing at it, what is it usually doing? It is usually looping or iterating through something. The DCO wont help with small blocks of code that execute in 500uS, but you dont need help with that sort of code anyway. What you want to improve is exactly the type of code the DCO can improve: the kind of code that takes several dozen milliseconds (or more) to execute. That is when you begin to notice the lag in your cpu.mpokwsths - Wednesday, February 4, 2015 - link
Joshua & Ryan,please update the charts with the bench results of the newer version of Androbench 4: https://play.google.com/store/apps/details?id=com....
(I had previously commented on the fact that you can't safely compare the i/o results of different OS AND different bench apps).
Androbench 4 is redesigned it to use multiple i/o threads (as a proper i/o bench app should have) and produces vastly improved results on both Lollipop and earlier Android devices.
You will not be able to compare the newer results with older ones, but at least it will put an end to this ridiculus ι/ο performance difference between iOS and Android, the one you persistently -but falsly- keep projecting.
Andrei Frumusanu - Wednesday, February 4, 2015 - link
I tested this out on several of my devices and could see only minor improvements, all within 10%. The performance difference to iOS devices does not seem to be a dupe at all.mpokwsths - Wednesday, February 4, 2015 - link
My results strongly disagree with you:Nexus 5: Seq Write: 19MB/s --> 55 MB/s
Rand Write: 0.9 --> 2.9 MB/s
Sony Z3 Tablet: Seq Write: 21 MB/s --> 53 MB/s
Rand Write: 1,6 MB/s --> 8MB/s
Seq Read: 135 MB/s --> 200MB/s
I can upload pics showing my findings.
mpokwsths - Wednesday, February 4, 2015 - link
Meet the fastest Nexus 5 in the world:https://www.dropbox.com/s/zkhn073xy8l28ry/Screensh...;)