Intel Xeon E5 Version 3: Up to 18 Haswell EP Cores
by Johan De Gelas on September 8, 2014 12:30 PM ESTEnergy and HPC
AVX/FP intensive applications are known to be real power hogs. How bad can it get? We used the OpenFOAM test and measured both average and maximum power (the 95th percentile). Average power tells us how much energy will be consumed for each HPC job while maximum power is important as you have to allocate enough amps to your rack to feed your HPC server/cluster.
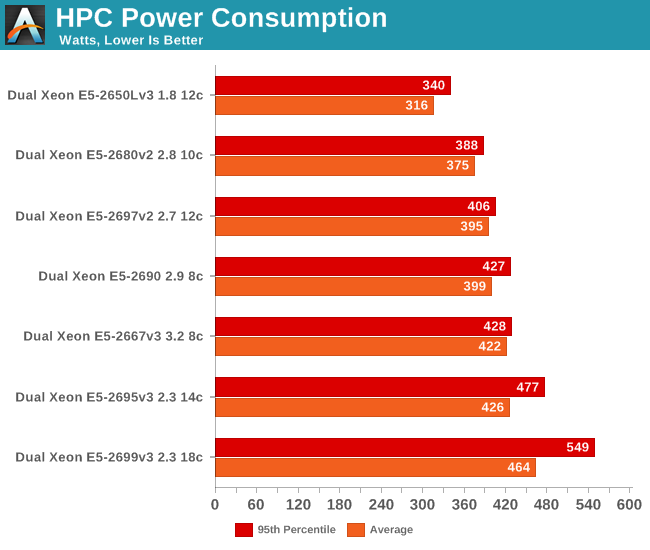
This confirms there is more going on than just the fact that our "Wildcat Pass" server consumes more than the Supermicro server in this test. At peak, the Xeon E5-2699 v3 consumes almost 450W (!!) more than at idle. Even if we assume that the fans take 100W, that means that 350W is going to the CPUs. That's around 175W per socket, and even though it's measured at the wall and thus includes the Voltager regulators, that's a lot of power. The Xeon E5-2699 v3 is a massive powerhouse, but it's one that needs a lot of amps to perform its job.
Interestingly, the Xeon E5-2695 v3 is also using more power than all previous Xeons. The contrast with our Drupal power measurements is very telling. In the Drupal test, the CPU was able to let many of the cores sleep a lot of the time. In OpenFOAM, all the cores are working at full bore and the superior power savings of the Haswell cores deep sleep states do not matter much. But which CPU is the winner? To make this more clear, we have to calculate the actual energy consumed (average power x time ran).
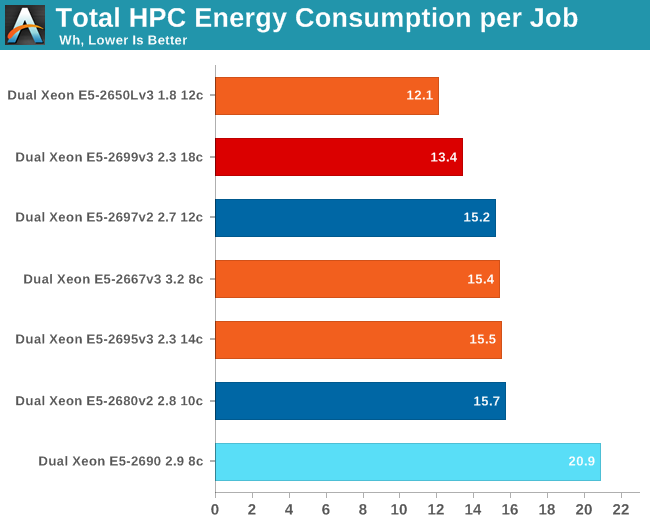
When we look at how much energy is consumed to get the job done, the picture changes. The old Xeon "Sandy Bridge EP" is far behind. It is clear that Intel has improved AVX efficiency quite a bit. The low power Xeon E5-2650L v3 is a clear winner. In second place, the fastest Xeon on the planet actually saves energy compared to the older Xeons, as long as you can provide the peak amps.


85 Comments
View All Comments
cmikeh2 - Monday, September 8, 2014 - link
In the SKU comparison table you have the E5-2690V2 listed as a 12/24 part when it is in fact a 10/20 part. Just a tiny quibble. Overall a fantastic read.KAlmquist - Monday, September 8, 2014 - link
Also, the 2637 v2 is 4/8, not 6/12.isa - Monday, September 8, 2014 - link
Looking forward to a new supercomputer record using these behemoths.Bruce Allen - Monday, September 8, 2014 - link
Awesome article. I'd love to see Cinebench and other applications tests. We do a lot of rendering (currently with older dual Xeons) and would love to compare these new Xeons versus the new 5960X chips - software license costs per computer are so high that the 5960X setups will need much higher price/performance to be worth it. We actually use Cinema 4D in production so those scores are relevant. We use V-Ray, Mental Ray and Arnold for Maya too but in general those track with the Cinebench scores so they are a decent guide. Thank you!Ian Cutress - Monday, September 8, 2014 - link
I've got some E5 v3 Xeons in for a more workstation oriented review. Look out for that soon :)fastgeek - Monday, September 8, 2014 - link
From my notes a while back... two E5-2690 v3's (all cores + turbo enabled) under 2012 Server yielded 3,129 for multithreaded and 79 for single.While not Haswell, I can tell you that four E5-4657L V2's returned 4,722 / 94 respectively.
Hope that helps somewhat. :-)
fastgeek - Monday, September 8, 2014 - link
I don't see a way to edit my previous comment; but those scores were from Cinebench R15wireframed - Saturday, September 20, 2014 - link
You pay for licenses for render Nodes? Switch to 3DS, and you get 9999 nodes for free (unless they changed the licensing since I last checked). :)Lone Ranger - Monday, September 8, 2014 - link
You make mention that the large core count chips are pretty good about raising their clock rate when only a few cores are active. Under Linux, what is the best way to see actual turbo frequencies? cpuinfo doesn't show live/actual clock rate.JohanAnandtech - Monday, September 8, 2014 - link
The best way to do this is using Intel's PCM. However, this does not work right now (only on Sandy and Ivy, not Haswel) . I deduced it from the fact that performance was almost identical and previous profiling of some of our benchmarks.