Samsung SSD 845DC EVO/PRO Performance Preview & Exploring IOPS Consistency
by Kristian Vättö on September 3, 2014 8:00 AM ESTPerformance Consistency - Standard Deviation
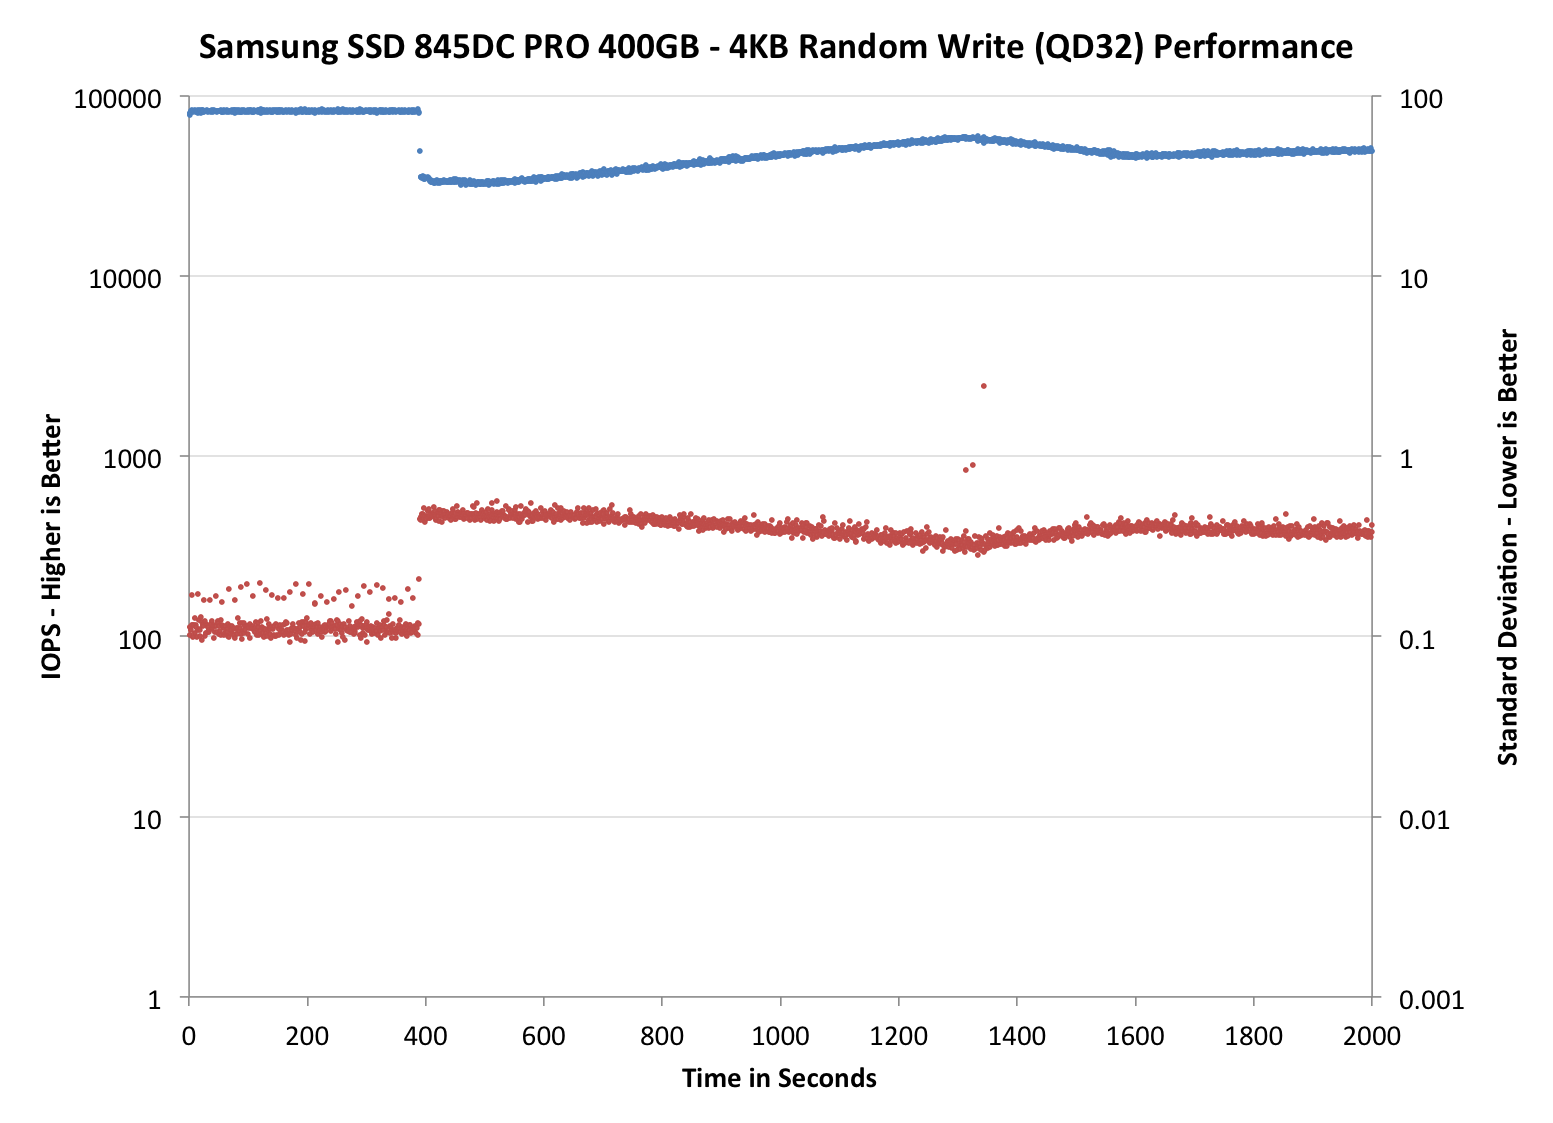
The second new data set is standard deviation. It gives us a more comprehensive idea of how the average IOPS really varies because in the end, worst-case IOPS is just showing the slowest IO of every second. That does not tell how the rest of the IOs are doing, which is where standard deviation becomes useful.
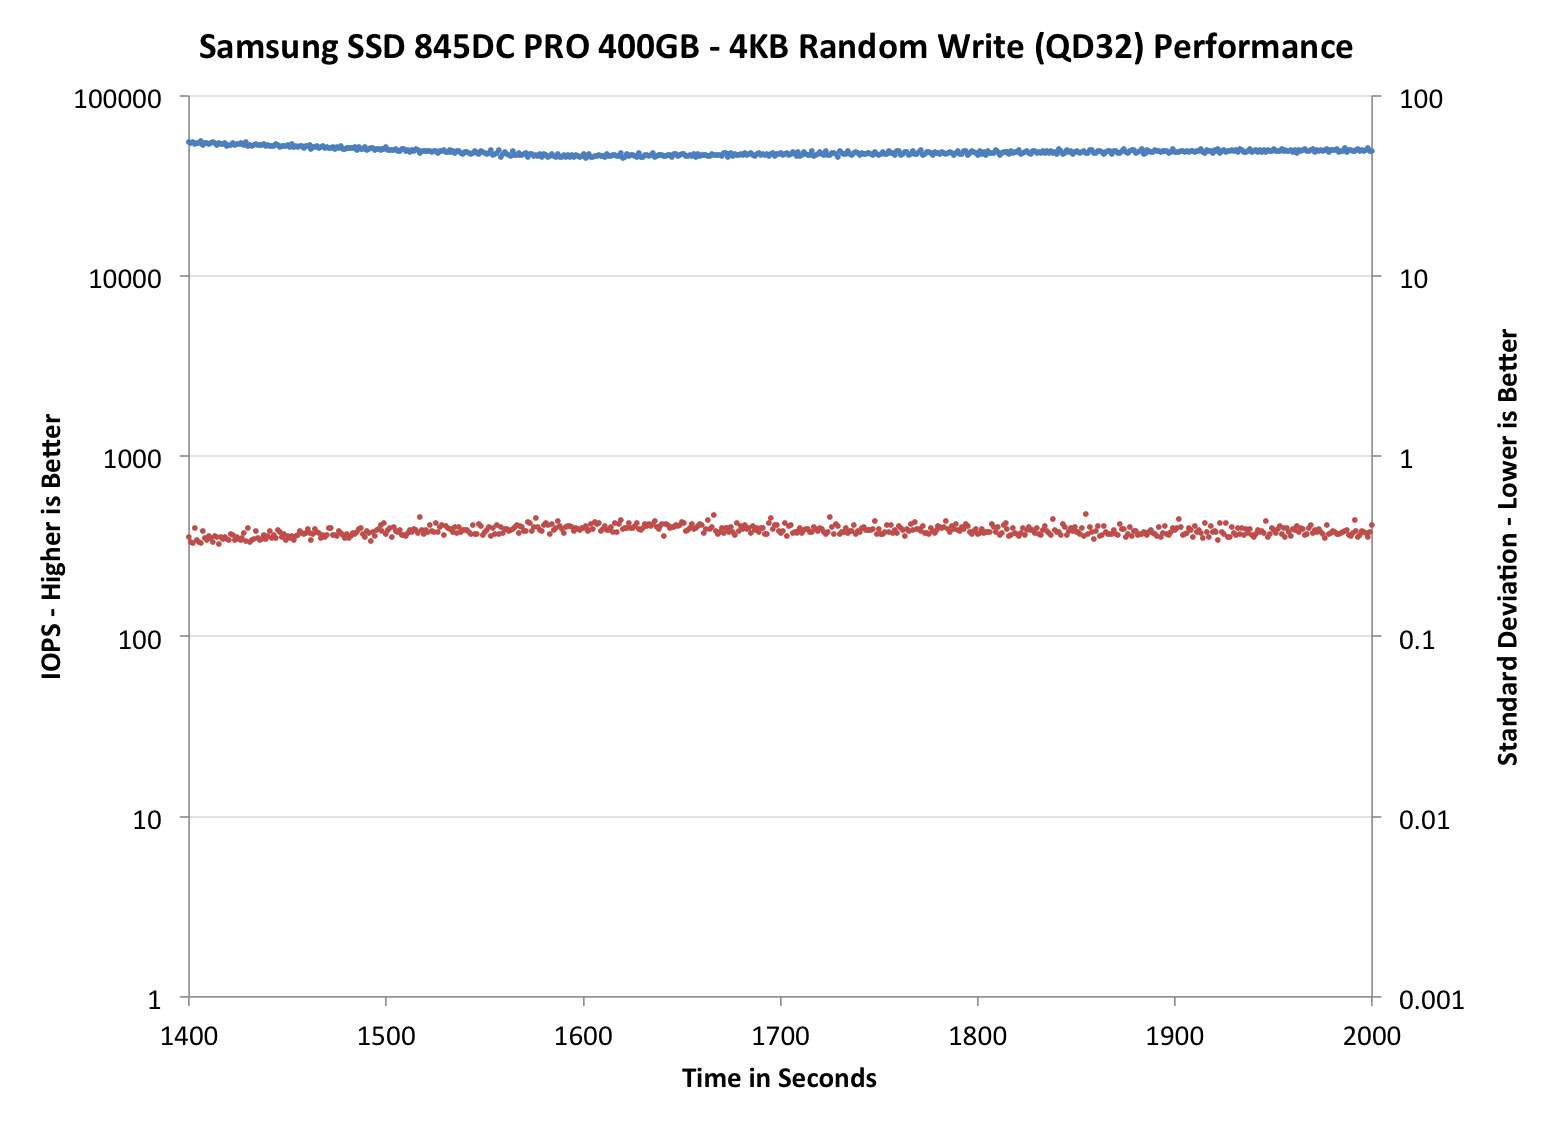
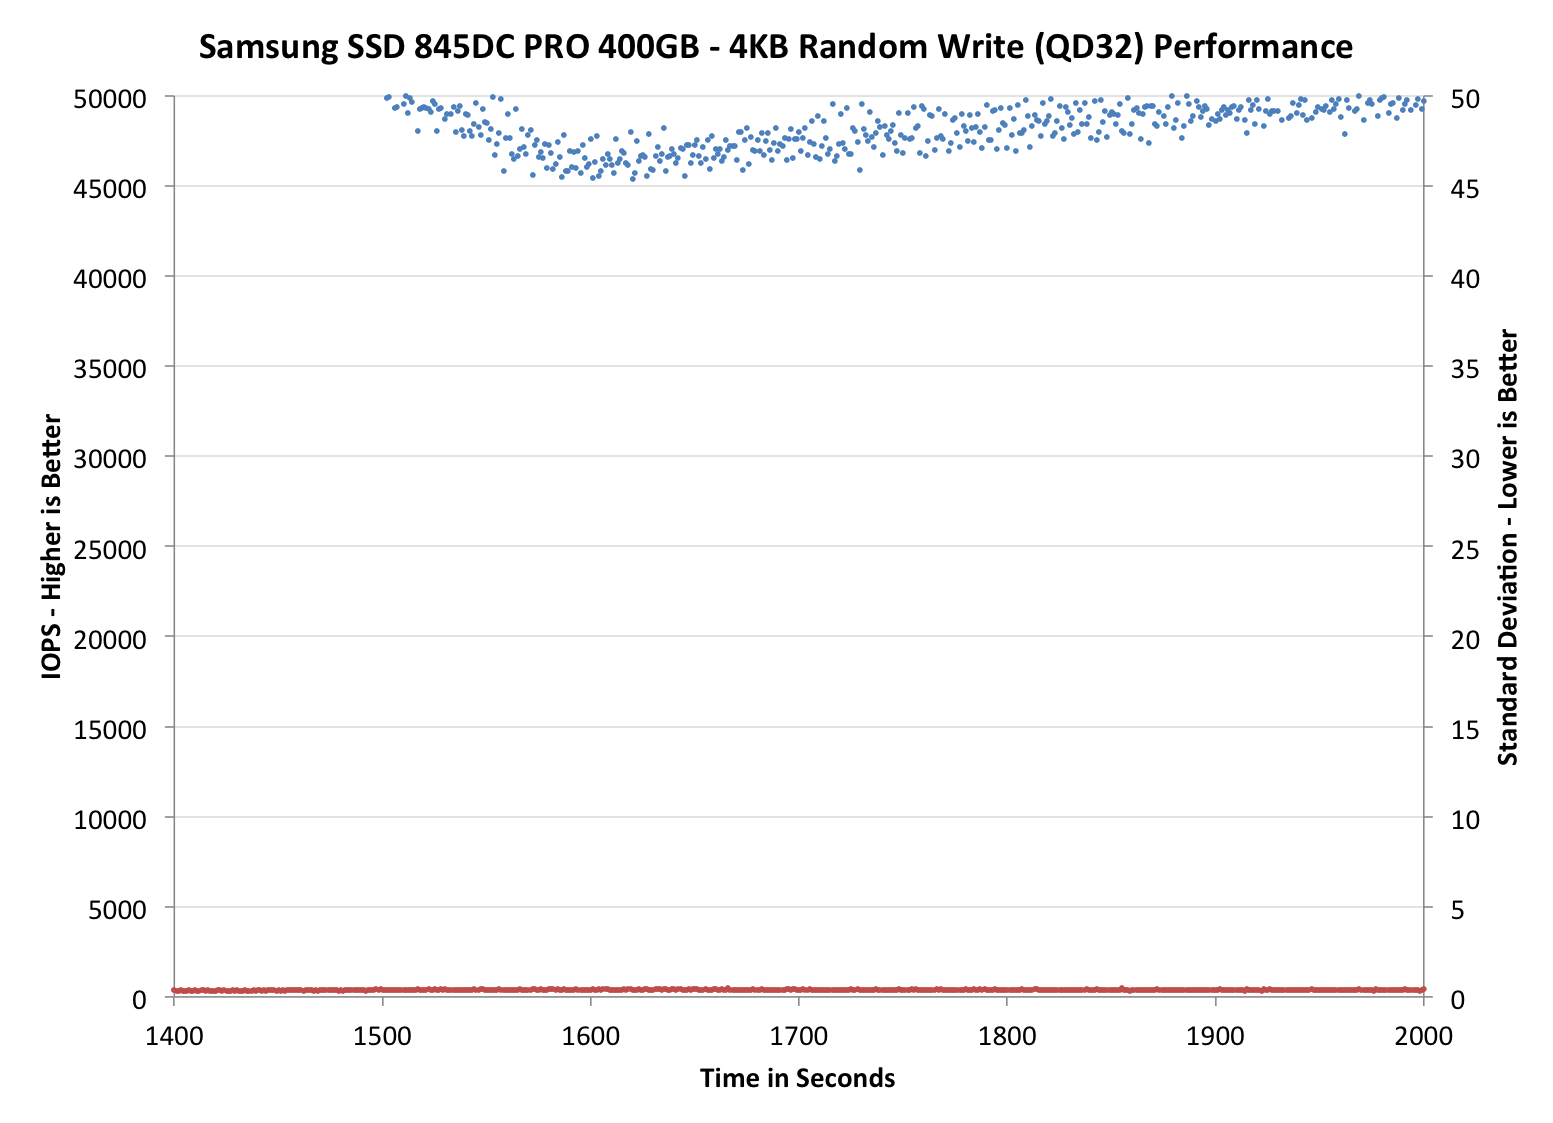
Once again, the blue dots represent average IOPS, while the red dots are now standard deviation instead of worst-case IOPS. The graphs are dual-axis with IOPS on the left and standard deviation on the right with its own scale. For these graphs, the lower the standard deviation, the less variance there is in performance and the more consistent the performance is, which is better.
The 845DC EVO and PRO are awesome again. The EVO sports a standard deviation of around one, which is slightly better than what the S3500 offers and significantly better than M500DC's. Given that EVO's IOPS is very comparable with the S3500's, the EVO presents some serious competition to Intel despite the fact that the EVO uses slower TLC NAND with the same 12.7% over-provisioning.
The PRO does even better and is without a doubt the most consistent enterprise SATA SSD. The S3700 comes close, but when you include that fact that the 845DC PRO provides around 15K more IOPS, there is no doubt that it is a better drive for write intensive workloads that require high consistency.


31 Comments
View All Comments
Inds - Wednesday, February 4, 2015 - link
Ok, this doesn't clear anything up. If my manufacturer is lying about the IOPS of my SSD, how do I figure out the real value?If they aren't lying about the 97,000 random read IOPS, how many megabytes per second is this for 4KB?
What exactly is the formula? You never elaborate on this in the article beyond senseless ramble.
First of all, how am I gonna know what the queue length even is? The way I see it on benchmark tests, low queue depths have lower MB/s than higher ones so this confuses the hell out of me.
But okay, I wanna know how my 840 Evo will perform random reads in the worst case scenario and QD1 seems to be the worst case scenario according to all the benchmark evidence.
In that case, I must time the QD by the latency. My latency I believe is 1 ms so my result is 1000. 1000 IOPS? Okay, so my 4KB random read speed will be 4 MB/s? That's nowhere close to the real result CrystalDiskMark shows.