Samsung SSD 845DC EVO/PRO Performance Preview & Exploring IOPS Consistency
by Kristian Vättö on September 3, 2014 8:00 AM ESTPerformance Consistency - Standard Deviation
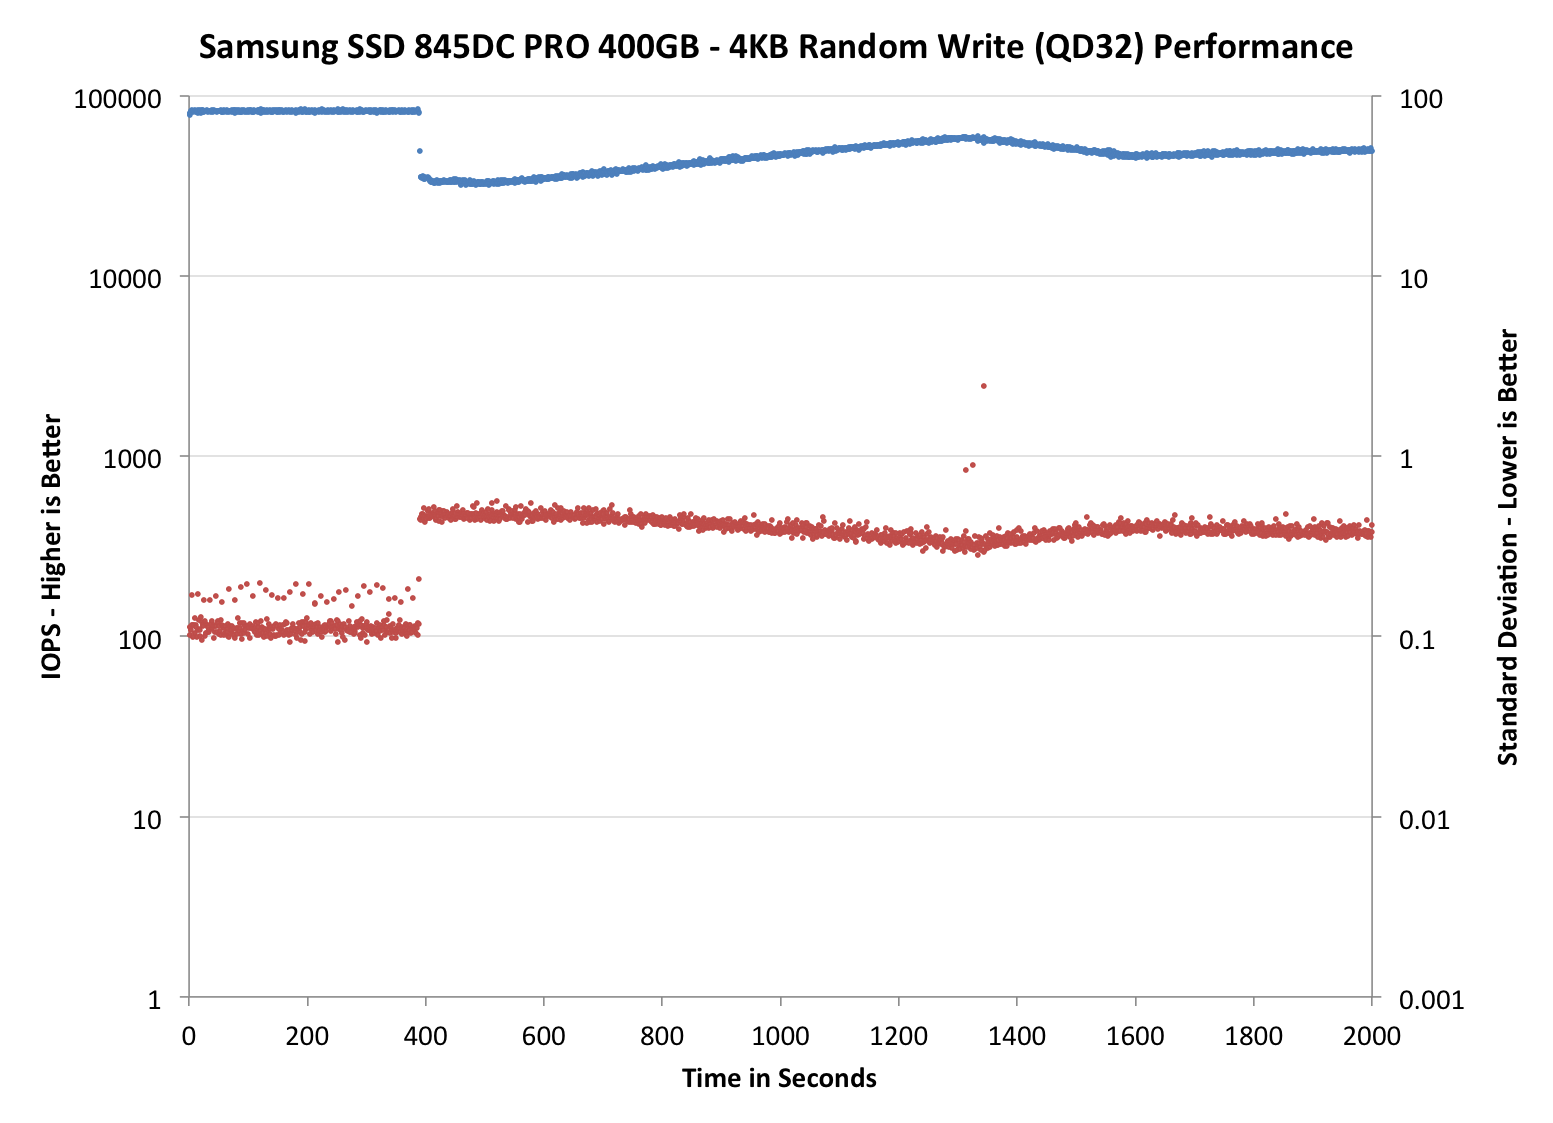
The second new data set is standard deviation. It gives us a more comprehensive idea of how the average IOPS really varies because in the end, worst-case IOPS is just showing the slowest IO of every second. That does not tell how the rest of the IOs are doing, which is where standard deviation becomes useful.
Once again, the blue dots represent average IOPS, while the red dots are now standard deviation instead of worst-case IOPS. The graphs are dual-axis with IOPS on the left and standard deviation on the right with its own scale. For these graphs, the lower the standard deviation, the less variance there is in performance and the more consistent the performance is, which is better.
The 845DC EVO and PRO are awesome again. The EVO sports a standard deviation of around one, which is slightly better than what the S3500 offers and significantly better than M500DC's. Given that EVO's IOPS is very comparable with the S3500's, the EVO presents some serious competition to Intel despite the fact that the EVO uses slower TLC NAND with the same 12.7% over-provisioning.
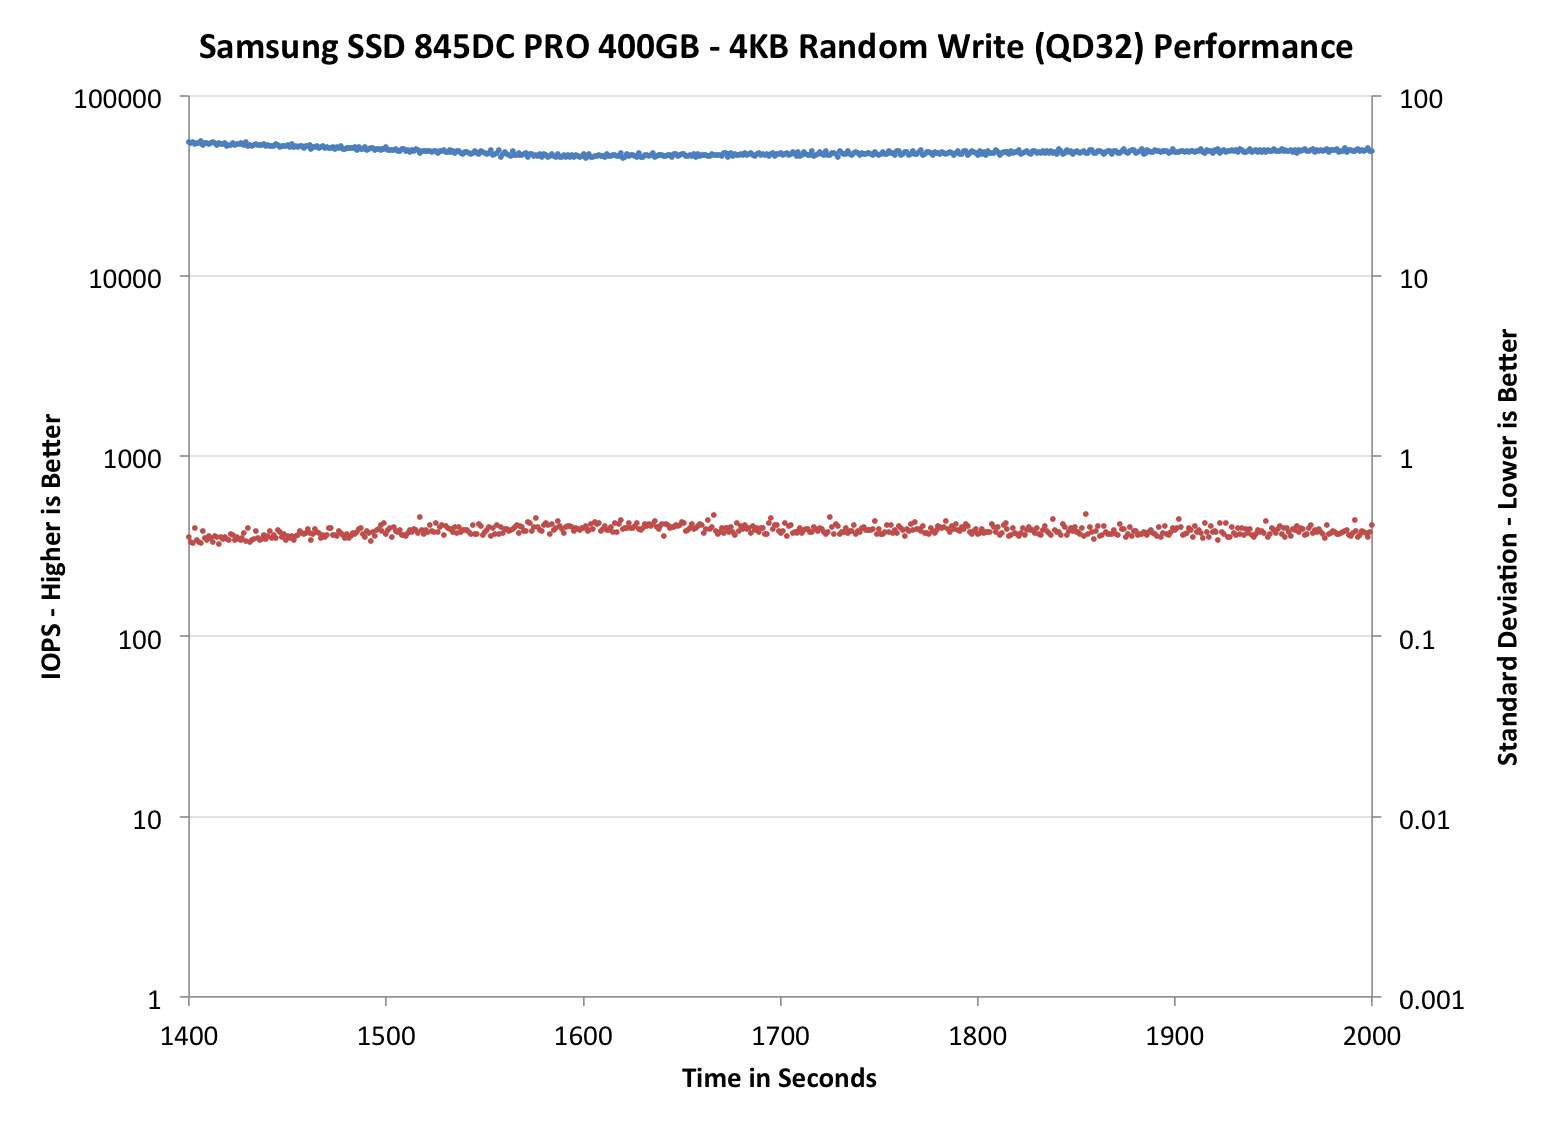
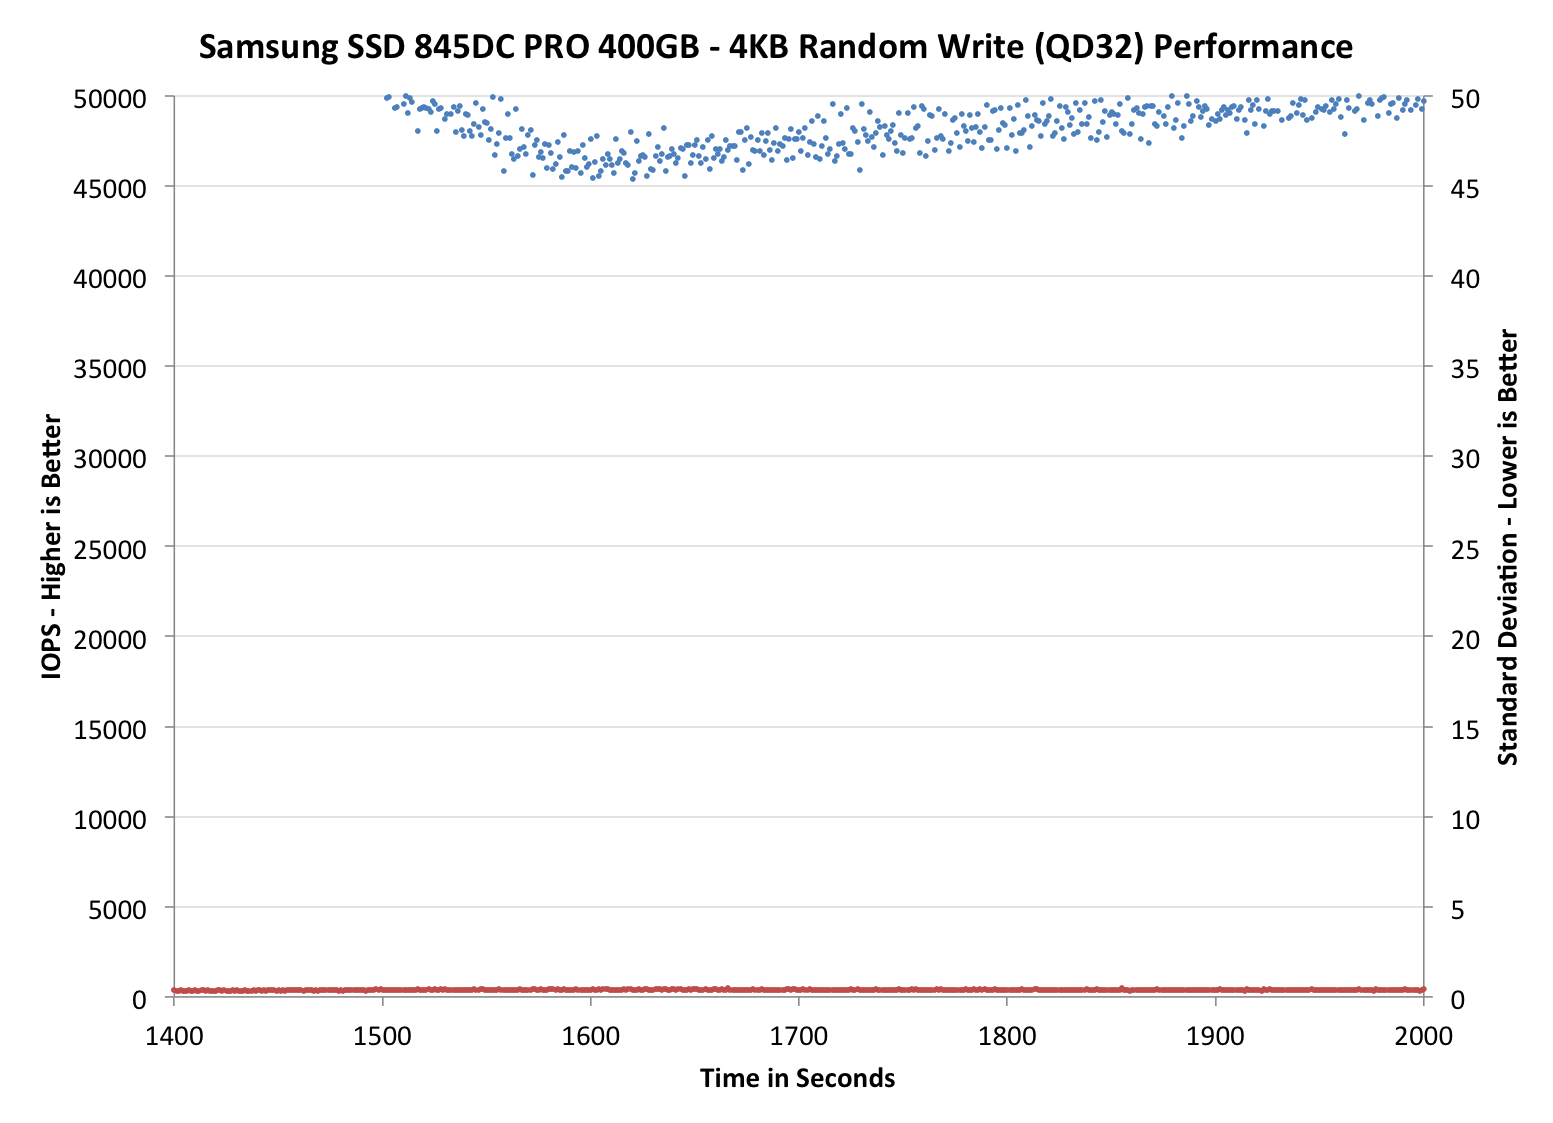
The PRO does even better and is without a doubt the most consistent enterprise SATA SSD. The S3700 comes close, but when you include that fact that the 845DC PRO provides around 15K more IOPS, there is no doubt that it is a better drive for write intensive workloads that require high consistency.


31 Comments
View All Comments
LiviuTM - Wednesday, September 3, 2014 - link
Great article, Kristian.I enjoyed finding more about latency, IOPS and throughput and the relationship between them.
Keep up the good work :)
Chapbass - Wednesday, September 3, 2014 - link
I would like to echo this statement. Some of the heavy technical stuff makes my eyes glaze over at times, but this was so well written that I really got into it. Awesome article, Kristian.romrunning - Wednesday, September 3, 2014 - link
"The only difference between the 845DC EVO and PM853T is the firmware and the PM853T is geared more towards sustained workloads, which results in slightly higher random write speed (15K IOPS vs 14K IOPS)."Chart for PM853T shows 14K for Random Writes, so likely needs to be corrected.
Kristian Vättö - Wednesday, September 3, 2014 - link
Good catch, I was waiting for Samsung to send me the full data sheet for the PM853T but I never got it, so I accidentally left the 845DC EVO specs there. I've now updated it with the specs I have and with some additional commentary.JellyRoll - Wednesday, September 3, 2014 - link
The only issue with calculating performance as listed on the first page is that it assumes that the SSD works perfectly in all aspects. No ECC, no wear leveling, no garbage collection. None of these are true. Even without those factors no SSD will ever behave absolutely perfectly in every aspect at all times....anything but. That is why there is so much variation between vendors. It would be impossible to calculate performance using that method with an SSD in the real world.Kristian Vättö - Wednesday, September 3, 2014 - link
Of course real world is always different because the transfer size and queue depth are constantly changing and no SSD behaves perfectly. I mentioned that it is a hypothetical SSD and obviously no real drive would have a constant latency of 1ms or perfect transfer size scaling. The goal was to demonstrate how the metrics are related and it is easier with concrete, albeit hypothetical, examples.hrrmph - Wednesday, September 3, 2014 - link
I think you nailed it on the theoretical stuff (the relationships between the parameters), and presented it well (easy to understand).This has been bugging me for a while too, although I won't pretend to have gotten it figured out - it's just that I keep getting pickier in my lab notes and shopping specs about things like queue depth for a given size transfer for the specified performance. Leave any condition or parameter out, and the specs seem kinda useless. Leave everything in, and then I wonder which ones are pertinent to my usage scenarios.
Now, your explanation will have me questioning the manufacturer's motives for the selection of each unit of measure chosen for each listed spec. Who says this field of endeavor doesn't lead to obsession? :)
If any of the specs *are* pertinent to my usage scenarios, then I wonder which ones are *most* pertinent for which of my usage scenarios (laptop, versus general desktop, versus high powered workstation).
Any relationships that you discover or methods that you develop for the charts to help explain it better are most welcome. I know this is an over-simplification, but I would guess that most workstation users want to know:
- Is my drive limiting my performance (why did that operation stutter or lag, or why does it take so long - was it the drive)?
- Is there anything I can do about it that I can afford (mainly, what can I replace it with - new controller card, newer, better designed SSDs, better racks, cables, etc.)?
I am pleased that you are helping us out by further dissecting performance consistency / variation. I suspect that although SSDs are an order of magnitude (or more) better than HDDs at many tasks, the "devil is in the details," and that there is a reason that many SSD equipped machines still "hiccup," fairly frequently (although not nearly as often or as bad as HDD equipped machines). I also suspect that drive sub-systems are still one of the most common weaker links that is responsible for such hiccups.
I am particularly interested in the (usually) brutally difficult small file size tests. These tests seem to be able to bring even the best of machines to a crawl, and any device (ie: SSD) that can help performance on those tests seems to be very likely to be noticeable to the end user.
If you do indeed find "let downs" in performance consistency (or any other drive related performance spec), then maybe the manufacturers will work to improve upon those weaknesses until we get "buttery smooth" performance...
...or at least until we can definitively start looking at other sub-systems (compute, memory, I/O, etc.) to solve the hiccups.
My introductory courses were on 8086 computers running DOS. I don't remember them often stopping to think about anything... until I started "hitting" the disks heavily. The more things change, the more I suspect they stay the same ;)
So I keep allocating more of my budget to disks and disk sub-systems than anything else. AT's articles are thus *very* helpful in "aiming" that budget and I hope you have some revelations for us soon that show which products are worth the money.
iwod - Wednesday, September 3, 2014 - link
I have been wondering for a bit, why hasn't Enterprise switched to some other interconnect? Surely they could do PCI-E have have it directly connected to the CPU. ( Assuming they dont need those for GPU or other things ).And I have been Samsung being extremely aggressive with the web hosting market. Where Intel is lacking behind.
FunBunny2 - Wednesday, September 3, 2014 - link
"real" enterprise has been running SAS and FibreChannel for rather a long time. InfiniBand every now and again. To the extent that enterprise buys X,000 drives to parcel out to offices and such, then that's where the SATA drives go. But that's not really enterprise storage. Real enterprise SSD/flash/etc. doesn't have a list price (well, only in the sense that your car did) and I'd wager that not one of the enterprise SSD/flash companies (and no, Intel doesn't count) has ever offered up a sample to AnandTech.rossjudson - Thursday, September 4, 2014 - link
Fusion-io (and others) have been doing precisely this (PCIe connected flash storage) for a number of years. They are currently producing modules with up to 6TB of storage.