ASUS A88X-Pro Review: Kaveri, Kaveri, Quite Contrary
by Ian Cutress on April 22, 2014 11:59 AM EST- Posted in
- Motherboards
- AMD
- Asus
- Kaveri
Many thanks to...
We must thank the following companies for kindly providing hardware for our test bed:
Thank you to OCZ for providing us with 1250W Gold Power Supplies and SSDs.
Thank you to G.Skill and ADATA for providing us with memory kits.
Thank you to Corsair for providing us with an AX1200i PSU, Corsair H80i CLC and 16GB 2400C10 memory.
Thank you to ASUS for providing us with the AMD HD7970 GPUs and some IO Testing kit.
Thank you to MSI for providing us with the NVIDIA GTX 770 Lightning GPUs.
Thank you to Rosewill for providing us with the 500W Platinum Power Supply for mITX testing, BlackHawk Ultra, and 1600W Hercules PSU for extreme dual CPU + quad GPU testing, and RK-9100 keyboards.
Thank you to ASRock for providing us with the 802.11ac wireless router for testing.
Test Setup
| Test Setup | |
| Processor |
AMD A10-7850K (ES) 2 Modules, 4 Threads |
| Motherboards | ASUS A88X-Pro |
| Cooling |
Corsair H80i Thermalright TRUE Copper |
| Power Supply |
OCZ 1250W Gold ZX Series Corsair AX1200i Platinum PSU |
| Memory |
AMD Gaming 2x8GB DDR3-2133 10-11-11 Kit 2 x Corsair Vengeance Pro 2x8 GB DDR3-2400 10-12-12 Kit |
| Memory Settings | XMP |
| Video Cards |
MSI GTX 770 Lightning 2GB (1150/1202 Boost) ASUS HD7970 3GB (Reference) |
| Video Drivers |
Catalyst 13.12 NVIDIA Drivers 332.21 |
| Hard Drive | OCZ Vertex 3 256GB |
| Optical Drive | LG GH22NS50 |
| Case | Open Test Bed |
| Operating System | Windows 7 64-bit SP1 |
| USB 2/3 Testing | OCZ Vertex 3 240GB with SATA->USB Adaptor |
| WiFi Testing | D-Link DIR-865L 802.11ac Dual Band Router |
Power Consumption
Power consumption was tested on the system as a whole with a wall meter connected to the OCZ 1250W power supply, while in a single MSI GTX 770 Lightning GPU configuration. This power supply is Gold rated, and as I am in the UK on a 230-240 V supply, leads to ~75% efficiency > 50W, and 90%+ efficiency at 250W, which is suitable for both idle and multi-GPU loading. This method of power reading allows us to compare the power management of the UEFI and the board to supply components with power under load, and includes typical PSU losses due to efficiency. These are the real world values that consumers may expect from a typical system (minus the monitor) using this motherboard.
While this method for power measurement may not be ideal, and you feel these numbers are not representative due to the high wattage power supply being used (we use the same PSU to remain consistent over a series of reviews, and the fact that some boards on our test bed get tested with three or four high powered GPUs), the important point to take away is the relationship between the numbers. These boards are all under the same conditions, and thus the differences between them should be easy to spot.
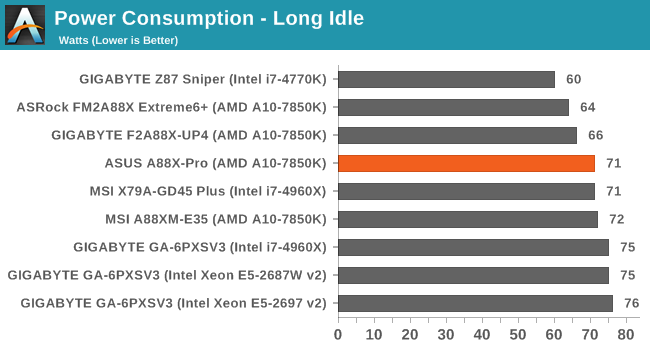
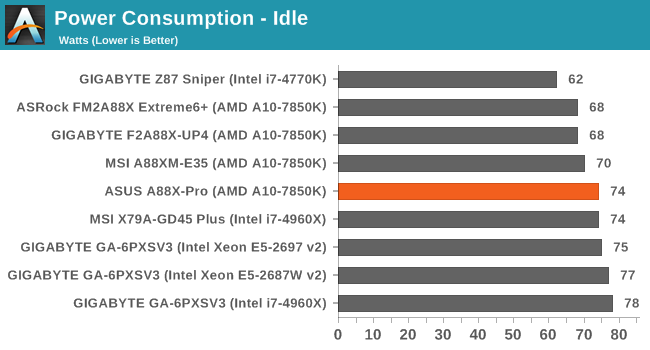
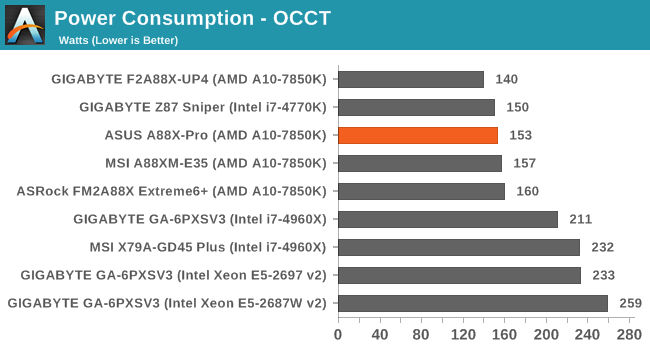
Power consumption on the A88X-Pro is in line with other motherboards, however the IR355x ICs of the GIGABYTE seem to have the advantage during high CPU loading.
Windows 7 POST Time
Different motherboards have different POST sequences before an operating system is initialized. A lot of this is dependent on the board itself, and POST boot time is determined by the controllers on board (and the sequence of how those extras are organized). As part of our testing, we are now going to look at the POST Boot Time - this is the time from pressing the ON button on the computer to when Windows 7 starts loading. (We discount Windows loading as it is highly variable given Windows specific features.) These results are subject to human error, so please allow +/- 1 second in these results.
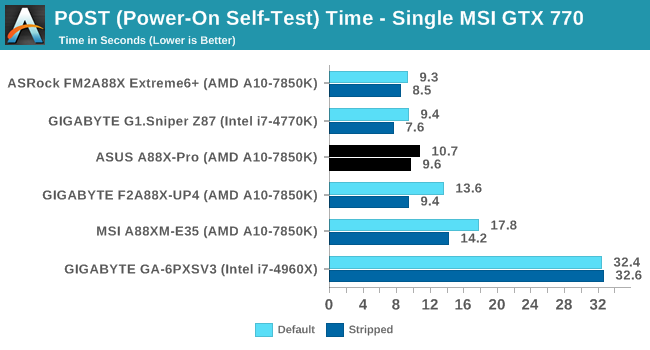
With the focus on fast booting into Windows 8, there is little incentive to optimize the POST sequence for other OSes. Nevertheless we see that a good ~1/3 of ASUS’ boot time can be saved by disabling unwanted controllers.


34 Comments
View All Comments
mikato - Wednesday, April 23, 2014 - link
"ASUS has suggested that my review CPU from AMD is from an initial batch of A10-7850K which may have higher-than-retail leakage issues. We are currently investigating this further.""Signs may point towards early batch of Kaveri processors that draw higher current, or the silicon lottery."
Wow, does this mean you are going to rerun the power consumption numbers from the Kaveri review and give us new graphs? You really should.
"we take a series of 170 images in various sizes and formats and convert them all into 640x480 .gif files, maintaining the aspect ratio"
I'm just curious how that's possible? Do you use blank bars on the sides? Or do they all have the same length:width ratio to match 640x480 to begin with?
Hrel - Thursday, April 24, 2014 - link
"A side note: we are looking into the restarting flaw that seems to occur during our specialised benchmark under high CPU load. Signs may point towards early batch of Kaveri processors that draw higher current, or the silicon lottery. We need to get a newer one in to retest our Photoscan benchmark."The fact that you still recommended this motherboard, despite the above quote, makes this sites recommendations meaningless. You're AMD bias is only going to do harm, not good. Please stop yourselves from showing such obvious favoritism. AMD platforms are less stable than Intel, this is a long known fact.
silverblue - Sunday, April 27, 2014 - link
And this is the sort of FUD that AMD and its customers have to put up with.Haravikk - Sunday, April 27, 2014 - link
It's nice to see AMD still getting some good performance motherboards. This said, I have to say I really prefer the layout of the ASRock FM2A88-ITX+ motherboard, and wish more motherboards would do something similar. While it does get a little tight on the CPU cooler to have the memory angled "horizontally" towards the "top" of the motherboard, it just gives much better airflow and cooler RAM in general; I wish more manufacturers would do this, and just leave cooler manufacturers to adapt.