Samsung SSD 840 EVO mSATA (120GB, 250GB, 500GB & 1TB) Review
by Kristian Vättö on January 9, 2014 1:35 PM ESTRandom Read/Write Speed
The four corners of SSD performance are as follows: random read, random write, sequential read and sequential write speed. Random accesses are generally small in size, while sequential accesses tend to be larger and thus we have the four Iometer tests we use in all of our reviews.
Our first test writes 4KB in a completely random pattern over an 8GB space of the drive to simulate the sort of random access that you'd see on an OS drive (even this is more stressful than a normal desktop user would see). I perform three concurrent IOs and run the test for 3 minutes. The results reported are in average MB/s over the entire time. We use both standard pseudo randomly generated data for each write as well as fully random data to show you both the maximum and minimum performance offered by SandForce based drives in these tests. The average performance of SF drives will likely be somewhere in between the two values for each drive you see in the graphs. For an understanding of why this matters, read our original SandForce article.
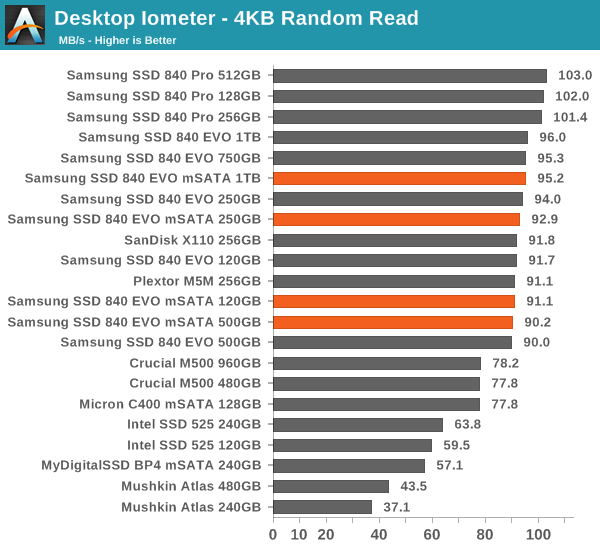
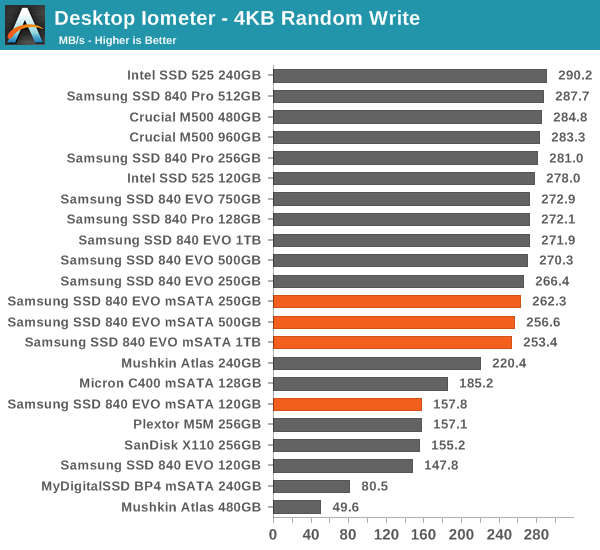
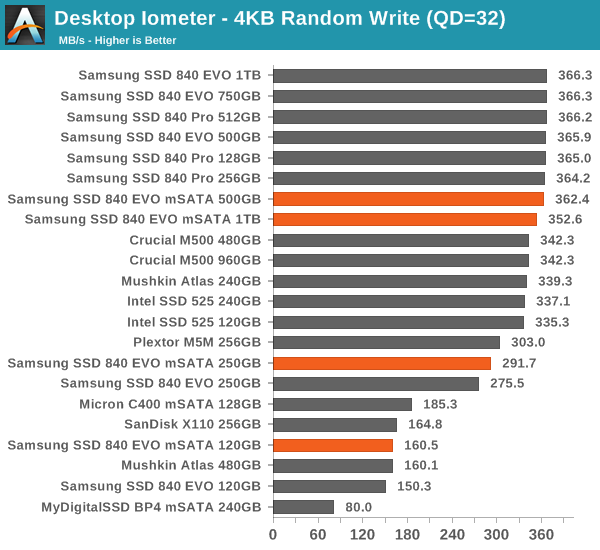
As expected, random IO performance is similar to the original EVO. There is some slight variation of course but nothing that stands out.
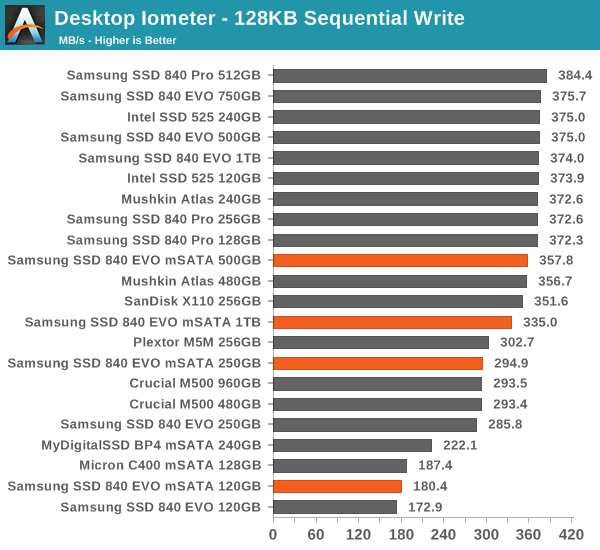
Sequential Read/Write Speed
To measure sequential performance I ran a 1 minute long 128KB sequential test over the entire span of the drive at a queue depth of 1. The results reported are in average MB/s over the entire test length.
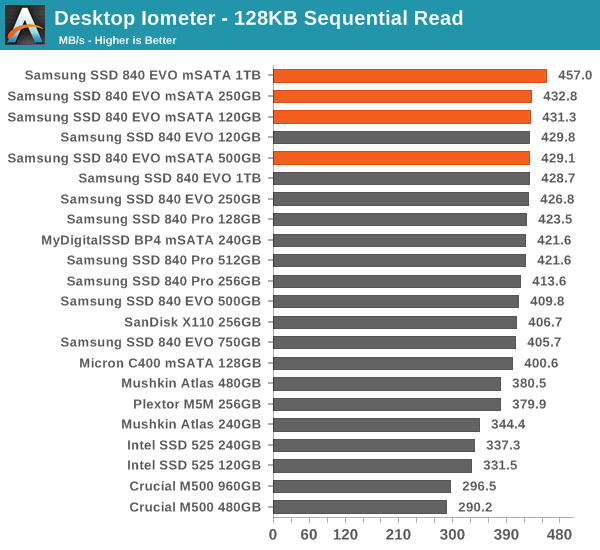
For some reason, the 1TB EVO mSATA is a few percent faster in 128KB sequential read test but falls short in the sequential write test. It's possible that the 16-die NAND has some effect on performance, which would explain the difference, but we're still dealing with rather small differences.
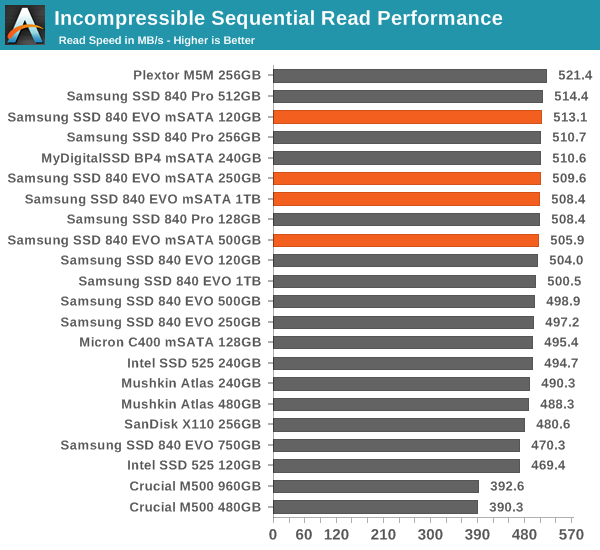
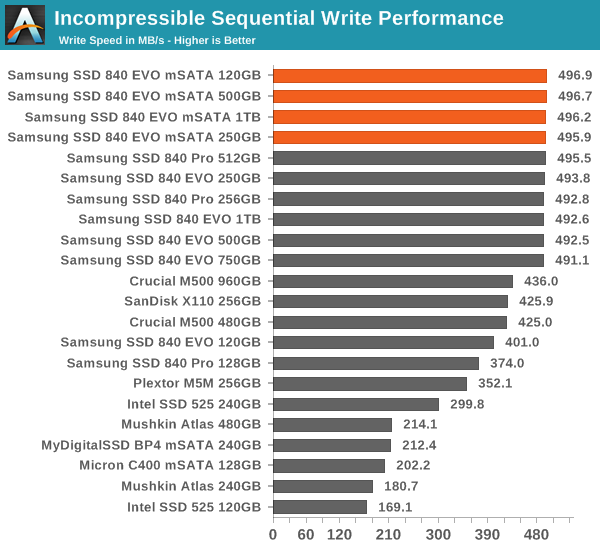
AS-SSD Incompressible Sequential Read/Write Performance
The AS-SSD sequential benchmark uses incompressible data for all of its transfers. The result is a pretty big reduction in sequential write speed on SandForce based controllers.


65 Comments
View All Comments
Chubblez - Thursday, January 9, 2014 - link
I have 8 5 shelf SAN's (EMC AX4-5f) all full of 1 and 2TB drives that would disagree with you.I also have 4 256G EVO's that get hammered pretty hard in an HP server, but I can't speak to the very long term effects. Initial data tells me your wrong on that as well.
Death666Angel - Sunday, January 12, 2014 - link
I have 8 2TB drives since October 2011 running in 2 RAID 5 in my file server (consumer grade Samsung, WD, Hitachi). I have 2 1TB 2.5" drives running since 2 years in my desktop. I have a 1TB and a 1.5TB 3.5" drive for well over 4 years in external enclosures. Not one failed. So let's pit anecdotal evidence against anecdotal evidence, shall we?dgingeri - Thursday, January 9, 2014 - link
I'd like to see Samsung put out a 500Gb or 1TB SSD with a m.2 PCIe connection. That with an adapter for two m.2 PCIe drives on a PCIe x4 card would make my year. I'd finally be able to get all the drives out of my system and bring it down to just motherboard, cards, H100, and power supply.romrunning - Thursday, January 9, 2014 - link
Why does the Samsung 840 Pro score really badly in the "Destroyer" tests, but are at the top of pretty much every other benchmark shown here?Kristian Vättö - Thursday, January 9, 2014 - link
Because it only has 7% OP by default, whereas most drives have 12% nowadays. In steady-state even small differences in OP can play a major role.blanarahul - Thursday, January 9, 2014 - link
Do you think it would be beneficial to 'not' have Turbowrite at or above 500 GB and focus more on parallism?? I ask this because a 250 GB 840 Evo achieves about 260 MB/s after it runs out of TW cache. So I would expect the 500 GB or above Evo to atleast reach 500 MB/s.Solid State Brain - Friday, January 10, 2014 - link
Question: do Samsung 840 EVO SSDs have less OP than the previous 840 ones, since a percentage of the reserved space is now used for the fixed SLC cache area/TurboWrite?With trim enabled, that should not be a problem (as it makes the drive have "dynamic OP" with free space), but under intense workloads it might, if it's the case.
Kristian Vättö - Friday, January 10, 2014 - link
Technically yes. The 840 actually has slightly better IO consistency, which the higher OP explains.https://dl.dropboxusercontent.com/u/128928769/IO%2...
(The title reads Intel DC S3700 but that's because I use it's graph as a basis of other graphs to guarantee that they're all the same size)
romrunning - Friday, January 10, 2014 - link
That's interesting. I guess that means if you manually over-provision the 840 Pro, then it should dominate the Destroyer benchmark as well. It would be nice to test that scenario out.Kristian Vättö - Friday, January 10, 2014 - link
Due to the nature of the Destroyer, it's unfortunately not possible to assign the test for a certain LBA range (i.e. add OP).