NVIDIA’s GeForce GTX Titan Review, Part 2: Titan's Performance Unveiled
by Ryan Smith & Rahul Garg on February 21, 2013 9:00 AM ESTTitan’s Compute Performance (aka Ph.D Lust)
Because GK110 is such a unique GPU from NVIDIA when it comes to compute, we’re going to shake things up a bit and take a look at compute performance first before jumping into our look at gaming performance.
On a personal note, one of the great things about working at AnandTech is all the people you get to work with. Anand himself is nothing short of fantastic, but what other review site also has a Brian Klug or a Jarred Walton? We have experts in a number of fields, and as a computer technology site that includes of course includes experts in computer science.
What I’m trying to say is that for the last week I’ve been having to fend off our CS guys, who upon hearing I had a GK110 card wanted one of their own. If you’ve ever wanted proof of just how big a deal GK110 is – and by extension Titan – you really don’t have to look too much farther than that.
Titan, its compute performance, and the possibilities it unlocks is a very big deal for researchers and other professionals that need every last drop of compute performance that they can get, for as cheap as they can get it. This is why on the compute front Titan stands alone; in NVIDIA’s consumer product lineup there’s nothing like it, and even AMD’s Tahiti based cards (7970, etc), while potent, are very different from GK110/Kepler in a number of ways. Titan essentially writes its own ticket here.
In any case, as this is the first GK110 product that we have had access to, we couldn’t help but run it through a battery of tests. The Tesla K20 series may have been out for a couple of months now, but at $3500 for the base K20 card, Titan is the first GK110 card many compute junkies are going to have real access to.
To that end I'd like to introduce our newest writer, Rahul Garg, who will be leading our look at Titan/GK110’s compute performance. Rahul is a Ph.D student specializing in the field of parallel computing and GPGPU technology, making him a prime candidate for taking a critical but nuanced look at what GK110 can do. You will be seeing more of Rahul in the future, but first and foremost he has a 7.1B transistor GPU to analyze. So let’s dive right in.
By: Rahul Garg
For compute performance, we first looked at two common benchmarks: GEMM (measures performance of dense matrix multiplication) and FFT (Fast Fourier Transform). These numerical operations are important in a variety of scientific fields. GEMM is highly parallel and typically compute heavy, and one of the first tests of performance and efficiency on any parallel architecture geared towards HPC workloads. FFT is typically memory bandwidth bound but, depending upon the architecture, can be influenced by inter-core communication bandwidth. Vendors and third-parties typically supply optimized libraries for these operations. For example, Intel supplies MKL for Intel processors (including Xeon Phi) and AMD supplies ACML and OpenCL-based libraries for their CPUs and GPUs respectively. Thus, these benchmarks measure the performance of the combination of both the hardware and software stack.
For GEMM, we tested the performance of NVIDIA's CUBLAS library supplied with CUDA SDK 5.0, on SGEMM (single-precision/fp32 GEMM) and DGEMM (double precision/fp64 GEMM) on square matrices of size 5k by 5k. For SGEMM on Titan, the data reported here was collected with boost disabled. We also conducted the experiments with boost enabled on Titan, but found that the performance was effectively equal to the non-boost case. We assume that it is because our test ran for a very short period of time and perhaps did not trigger boost. Therefore, for the sake of simpler analysis, we report the data with boost disabled on the Titan. If time permits, we may return to the boost issue in a future article for this benchmark.
Apart from the results collected by us for GTX Titan, GTX 680 and GTX 580, we refer to experiments conducted by Matsumoto, Nakasato and Sedukin reported in a technical report filed at the University of Aizu about GEMM on Radeon 7970. Their exact parameters and testbed are different than ours, and we include their results for illustrative purposes, as a ballpark estimate only. The results are below.
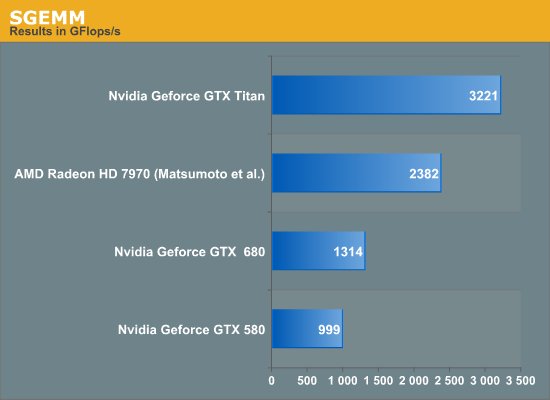
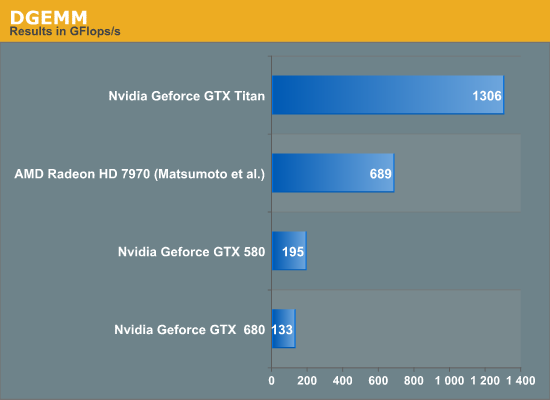
Titan rules the roost amongst the three listed cards in both SGEMM and DGEMM by a wide margin. We have not included Intel's Xeon Phi in this test, but the TItan's achieved performance is higher than the theoretical peak FLOPS of the current crop of Xeon Phi. Sharp-eyed readers will have observed that the Titan achieves about 1.3 teraflops on DGEMM, while the listed fp64 theoretical peak is also 1.3 TFlops; we were not expecting 100% of peak on the Titan in DGEMM. NVIDIA clarified that the fp64 rating for the Titan is a conservative estimate. At 837MHz, the calculated fp64 peak of Titan is 1.5 TFlops. However, under heavy load in fp64 mode, the card may underclock below the listed 837MHz to remain within the power and thermal specifications. Thus, fp64 ALU peak can vary between 1.3 TFlops and 1.5 TFlops and our DGEMM results are within expectations.
Next, we consider the percentage of fp32 peak achieved by the respective SGEMM implementations. These are plotted below.
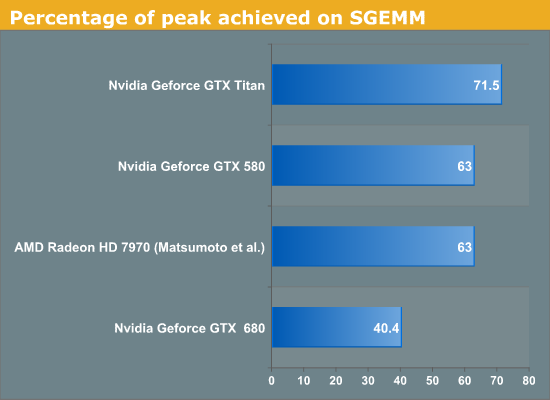
Titan achieves about 71% of its peak while GTX 680 only achieves about 40% of the peak. It is clear that while both GTX 680 and Titan are said to be Kepler architecture chips, Titan is not just a bigger GTX 680. Architectural tweaks have been made that enable it to reach much higher efficiency than the GTX 680 on at least some compute workloads. GCN based Radeon 7970 obtains about 63% of peak on SGEMM using Matsumoto et al. algorithm, and Fermi based GTX 580 also obtains about 63% of peak using CUBLAS.
For FFT, we tested the performance of 1D complex-to-complex inplace transforms of size 225 using the CUFFT library. Results are given below.
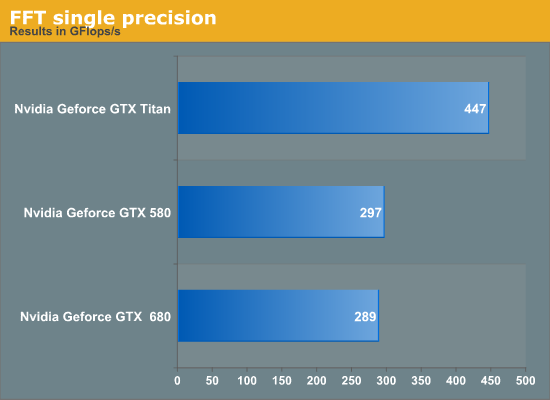
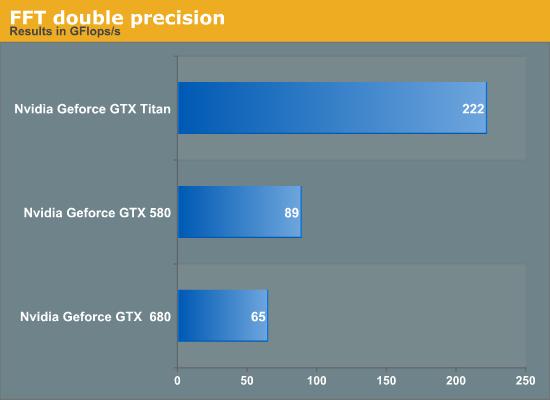
Titan outperforms the GTX 680 in FFT by about 50% in single-precision. We suspect this is primarily due to increased memory bandwidth on Titan compared to GTX 680 but we have not verified this hypothesis. GTX 580 has a slight lead over the GTX 680. Again, if time permits, we may return to the benchmark for a deeper analysis. Titan achieves about 3.4x the performance of GTX 680 but this is not surprising given the poor fp64 execution resources on the GTX 680.
We then looked at an in-house benchmark called SystemCompute, developed by our own Ian Cutress. The benchmark tests the performance on a variety of sample kernels that are representative of some scientific computing applications. Ian described the CPU version of these benchmarks in a previous article. Ian wrote the GPU version of the benchmarks in C++ AMP, which is a relatively new GPGPU API introduced by Microsoft in VS2012.
Microsoft's implementation of AMP compiles down to DirectCompute shaders. These are all single-precision benchmarks and should run on any DX11 capable GPU. The benchmarks include 2D and 3D finite difference solvers, 3d particle movement, n-body benchmark and a simple matrix multiplication algorithm. Boost is enabled on both the Titan and GTX 680 for this benchmark. We give the score reported by the benchmark for both cards, and report the speedup of the Titan over 680. Speedup greater than 1 implies Titan is faster, while less than 1 implies a slowdown.
| Benchmark | GTX 580 | GTX 680 | GTX Titan |
Speedup of Titan over GTX 680 |
| 2D FD | 9053 | 8445 | 12461 | 1.47 |
| 3D FD | 3133 | 3827 | 5263 | 1.37 |
| 3DPmo | 41722 | 26955 | 40397 | 1.49 |
| MatMul | 172 | 197 | 229 | 1.16 |
| nbody | 918 | 1517 | 2418 | 1.59 |
The benchmarks show between 16% and 60% improvement, with the most improvement coming from the relatively FLOP-heavy n-body benchmark. Interestingly, GTX 580 wins over the Titan in 3DPMo and wins over the 680 in 3DPmo and 2D.
Overall, GTX Titan is an impressive accelerator from compute perspective and posts large gains over its predecessors.


337 Comments
View All Comments
CeriseCogburn - Saturday, February 23, 2013 - link
Here you are arac, some places can do things this place claims it cannot.See the massive spanking amd suffers.
http://www.bit-tech.net/hardware/2013/02/21/nvidia...
That's beyond a 40% lead for the nvidia Titan above and beyond the amd flagship. LOL
No problem. No cpu limited crap. I guess some places know how to test.
TITAN 110 min 156 max
7970ghz 72 min 94 max
TheJian - Sunday, February 24, 2013 - link
Jeez, I wish I had read your post before digging up my links. Yours is worse than mine making my point on skyrim even more valid.In your link the GTX670 takes out the 7970ghz even at 2560x1200. I thought all these dumb NV cards were bandwidth limited ;) Clear separation on all cards in this "cpu limited" benchmark on ALL resolutions.
Hold on let me wrap my head around this...So with your site, and my 3 links to skyrim benchmarks in my posts (one of them right here at anandtech telling how to add gfx, their 7970ghz article), 3/4 of them showing separations according to their GPU class...Doesn't that mean they are NOT cpu bound? Am I missing something here? :) Are you wondering if Ryan benched skyrim with the hi-res pack after it came out, found it got smacked around by NV and dropped it? I mean he's claiming he tested it right above your post and found skyrim cpu limited. Is he claiming he didn't think adding a HI-RES PACK that's official would NOT add graphical slowdowns? This isn't a LOW-RES pack right?
http://www.anandtech.com/show/6025/radeon-hd-7970-...
Isn't that Ryan's article:
"We may have to look at running extra graphics effects (e.g. TrSSAA/AAA) to thin the herd in the future."...Yep I think that's his point. PUT IN THE FREAKIN PACK. Because Skyrim didn't just become worthless as a benchmark as TONS are playing it, unlike Crysis Warhead and Dirt Showdown. Which you can feel free to check the server link I gave, nobody playing Warhead today either. I don't think anyone ever played Showdown to begin with (unlike warhead which actually was fun in circa 2008).
http://www.vgchartz.com/game/23202/crysis-warhead/
Global sales .01mil...That's a decimal point right?
http://www.vgchartz.com/game/70754/dirt-showdown/
It hasn't reached enough sales to post the decimal point. Heck xbox360 only sold 140K units globally. Meanwhile:
http://www.vgchartz.com/game/49111/the-elder-scrol...
2.75million sold (that's not a decimal any more)! Which one should be in the new game suite? Mods and ratings are keeping this game relevant for a long time to come. That's the PC sales ONLY (which is all we're counting here anyway).
http://elderscrolls.wikia.com/wiki/Official_Add-on...
The high-res patch is an OFFICIAL addon. Can't see why it's wrong to benchmark what EVERYONE would download to check out that bought the game, released feb 2012. Heck benchmark dawnguard or something. It came Aug 2012. I'm pretty sure it's still selling and being played. PCper, techpowerup, anandtech's review of the 7970ghz and now this bit-tech.net site. Skyrim's not worth benching but all 4 links show what to do (up the gfx!) and results come through fine and 3 sites show NV winning (your site of course the one of the four that ignores the game - hmm, sort of shows my bias comment doesn't it?). No cpu limit at 3 other sites who installed the OFFICIAL pack I guess, but you can't be bothered to test a HI-RES pack that surely stresses a gpu harder than without? What are we supposed to believe here?
Looks like you may have a point Cerise.
Thanks for the link BTW:
http://www.bit-tech.net/hardware/2013/02/21/nvidia...
You can consider witcher 2 added as a 15th benchmarkable game you left out Ryan. Just wish they'd turn on ubersampling. As mins are ~55 for titan here even at 2560x1600. Clearly with it on this would be a NON cpu limited game too (it isn't cpu limited even off). Please refrain from benchmarking games with less than a 100K units in sales. By definition that means nobody is playing them OR buying them right? And further we can extrapolate that nobody cares about their performance. Can anyone explain why skyrim with hires (and an addon that came after) is excluded but TWO games with basically ZERO sales are in here as important games that will be hanging with us for a few years?
CeriseCogburn - Tuesday, February 26, 2013 - link
Yes, appreciate it thanks, and your links I'll be checking out now.They already floated the poster vote article for the new game bench lineup, and what was settled upon already was Never Settle heavily flavored, so don't expect anything but the same or worse here.
That's how it goes and there's a lot of pressure and PC populism and that great 2 week yearly vacation, and certainly attempting to prop a dying amd ship that "enables" this whole branch of competition for review sites is certainly not ignored. A hand up, a hand out, give em hand !
lol
Did you see where Wiz there at TPU in Titan review mentioned nVidia SLI plays 18 of 19 in house game tests and amd CF fails on 6 of them... currently fails on 6 of 19.
" NVIDIA has done a very good job here in the past, and out of the 19 games in our test suite, SLI only fails in F1 2012. Compare that to 6 out of 19 failed titles with AMD CrossFire. "
http://www.techpowerup.com/reviews/NVIDIA/GeForce_...
So the amd fanboys have a real problem recommending 79xx rather 7xxx or 6xxx doubled or tripled up as an alternative with equal or better cost and "some performance wins" when THIRTY THREE PERCENT OF THE TIME AMD CF FAILS.
I'm sorry, I was supposed to lie about that and claim all of amd's driver issues are behind it and it's all equal and amd used to have problems and blah blah blah the green troll company has driver issues too and blah blah blah...
CeriseCogburn - Tuesday, February 26, 2013 - link
Oh man, investigative reporting....lol" http://www.vgchartz.com/game/23202/crysis-warhead/
Global sales .01mil...That's a decimal point right?
http://www.vgchartz.com/game/70754/dirt-showdown/
It hasn't reached enough sales to post the decimal point. Heck xbox360 only sold 140K units globally. Meanwhile:
http://www.vgchartz.com/game/49111/the-elder-scrol...
2.75million sold (that's not a decimal any more)! Which one should be in the new game suite? "
Well it's just a mad, mad, amd world ain't it.
You have a MASSIVE point there.
Excellent link, that's a bookmark.
Zingam - Thursday, February 21, 2013 - link
GeForce Titan "That means 1/3 FP32 performance, or roughly 1.3TFLOPS"Playstation 4 "High-end PC GPU (also built by AMD), delivering 1.84TFLOPS of performance"
Can somebody explain to me how that above could be? GeForce Titan $999 graphics card has much lesser performance than what would be in basically (if I understand properly) an APU by AMD for $500 for the full system??? I doubt that Sony will accept $1000 or more loss but what I find even more doubtful that an APU could have that much performance.
Please, somebody clarify!
chizow - Thursday, February 21, 2013 - link
1/3 FP32 is double-precision FP64 throughput for Titanic. The PS4 must be quoting single-precision FP32 throughput and 1.84TFlops is nothing impressive in that regard. I believe GT200/RV670 were producing numbers in that range for single-precision FLOPs.Blazorthon - Thursday, February 21, 2013 - link
You are correct about PS4 quoting single precision and such, but I'm sure that you're wrong about GT200 being anywhere near 1.8TFLOPS in single precision. That number is right around the Radeon 7850.chizow - Saturday, February 23, 2013 - link
GT200 was around 1TFlop, I was confused because the same gen cards (RV670) were in the 1.2-1.3TFLOP range due to AMD's somewhat overstated VLIW5 theoretical peak numbers. Cypress for example was ~2.5TFlops so I wasn't too far off the mark in quoted TFLOPs.But yes if PS4 is GCN the performance would be closer to a 7850 in an apples to apples comparison.
frogger4 - Thursday, February 21, 2013 - link
Yep, the quoted number for the PS4 is the single precision performance. It's just over the single precision FP for the HD7850 at 1.76flops, and it has one more compute unit, so that makes sense. The double precision for Pitcairn GPUs is 1/16th of that.The single precision performance for the Titan is (more than) three times the 1.3Tflop double precision number. Hope that clears it up!
StealthGhost - Thursday, February 21, 2013 - link
Why are the settings/resolution used for, at least Battlefield 3, not consistent with those used in previous tests on GPUs, most directly those in Bench? Makes it harder to compare.Bench is such a great tool, it should be constantly updated and completely relevant, not discarded like it seems to be with these tests.