NVIDIA’s GeForce GTX Titan Review, Part 2: Titan's Performance Unveiled
by Ryan Smith & Rahul Garg on February 21, 2013 9:00 AM ESTTitan’s Compute Performance (aka Ph.D Lust)
Because GK110 is such a unique GPU from NVIDIA when it comes to compute, we’re going to shake things up a bit and take a look at compute performance first before jumping into our look at gaming performance.
On a personal note, one of the great things about working at AnandTech is all the people you get to work with. Anand himself is nothing short of fantastic, but what other review site also has a Brian Klug or a Jarred Walton? We have experts in a number of fields, and as a computer technology site that includes of course includes experts in computer science.
What I’m trying to say is that for the last week I’ve been having to fend off our CS guys, who upon hearing I had a GK110 card wanted one of their own. If you’ve ever wanted proof of just how big a deal GK110 is – and by extension Titan – you really don’t have to look too much farther than that.
Titan, its compute performance, and the possibilities it unlocks is a very big deal for researchers and other professionals that need every last drop of compute performance that they can get, for as cheap as they can get it. This is why on the compute front Titan stands alone; in NVIDIA’s consumer product lineup there’s nothing like it, and even AMD’s Tahiti based cards (7970, etc), while potent, are very different from GK110/Kepler in a number of ways. Titan essentially writes its own ticket here.
In any case, as this is the first GK110 product that we have had access to, we couldn’t help but run it through a battery of tests. The Tesla K20 series may have been out for a couple of months now, but at $3500 for the base K20 card, Titan is the first GK110 card many compute junkies are going to have real access to.
To that end I'd like to introduce our newest writer, Rahul Garg, who will be leading our look at Titan/GK110’s compute performance. Rahul is a Ph.D student specializing in the field of parallel computing and GPGPU technology, making him a prime candidate for taking a critical but nuanced look at what GK110 can do. You will be seeing more of Rahul in the future, but first and foremost he has a 7.1B transistor GPU to analyze. So let’s dive right in.
By: Rahul Garg
For compute performance, we first looked at two common benchmarks: GEMM (measures performance of dense matrix multiplication) and FFT (Fast Fourier Transform). These numerical operations are important in a variety of scientific fields. GEMM is highly parallel and typically compute heavy, and one of the first tests of performance and efficiency on any parallel architecture geared towards HPC workloads. FFT is typically memory bandwidth bound but, depending upon the architecture, can be influenced by inter-core communication bandwidth. Vendors and third-parties typically supply optimized libraries for these operations. For example, Intel supplies MKL for Intel processors (including Xeon Phi) and AMD supplies ACML and OpenCL-based libraries for their CPUs and GPUs respectively. Thus, these benchmarks measure the performance of the combination of both the hardware and software stack.
For GEMM, we tested the performance of NVIDIA's CUBLAS library supplied with CUDA SDK 5.0, on SGEMM (single-precision/fp32 GEMM) and DGEMM (double precision/fp64 GEMM) on square matrices of size 5k by 5k. For SGEMM on Titan, the data reported here was collected with boost disabled. We also conducted the experiments with boost enabled on Titan, but found that the performance was effectively equal to the non-boost case. We assume that it is because our test ran for a very short period of time and perhaps did not trigger boost. Therefore, for the sake of simpler analysis, we report the data with boost disabled on the Titan. If time permits, we may return to the boost issue in a future article for this benchmark.
Apart from the results collected by us for GTX Titan, GTX 680 and GTX 580, we refer to experiments conducted by Matsumoto, Nakasato and Sedukin reported in a technical report filed at the University of Aizu about GEMM on Radeon 7970. Their exact parameters and testbed are different than ours, and we include their results for illustrative purposes, as a ballpark estimate only. The results are below.
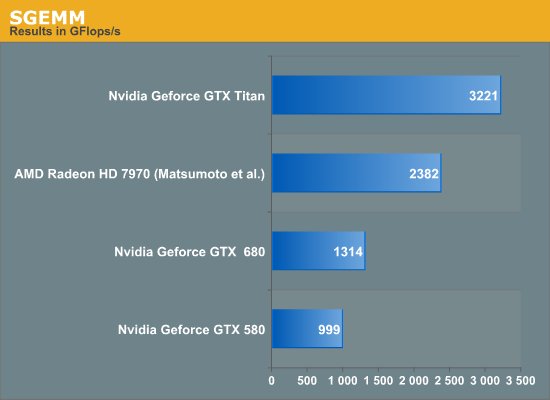
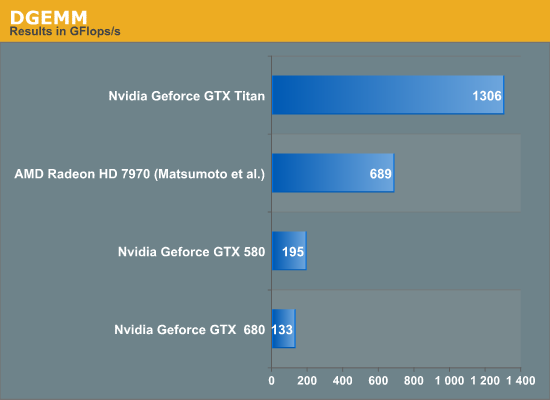
Titan rules the roost amongst the three listed cards in both SGEMM and DGEMM by a wide margin. We have not included Intel's Xeon Phi in this test, but the TItan's achieved performance is higher than the theoretical peak FLOPS of the current crop of Xeon Phi. Sharp-eyed readers will have observed that the Titan achieves about 1.3 teraflops on DGEMM, while the listed fp64 theoretical peak is also 1.3 TFlops; we were not expecting 100% of peak on the Titan in DGEMM. NVIDIA clarified that the fp64 rating for the Titan is a conservative estimate. At 837MHz, the calculated fp64 peak of Titan is 1.5 TFlops. However, under heavy load in fp64 mode, the card may underclock below the listed 837MHz to remain within the power and thermal specifications. Thus, fp64 ALU peak can vary between 1.3 TFlops and 1.5 TFlops and our DGEMM results are within expectations.
Next, we consider the percentage of fp32 peak achieved by the respective SGEMM implementations. These are plotted below.
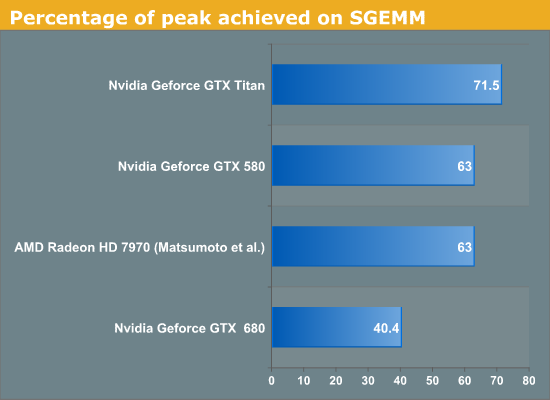
Titan achieves about 71% of its peak while GTX 680 only achieves about 40% of the peak. It is clear that while both GTX 680 and Titan are said to be Kepler architecture chips, Titan is not just a bigger GTX 680. Architectural tweaks have been made that enable it to reach much higher efficiency than the GTX 680 on at least some compute workloads. GCN based Radeon 7970 obtains about 63% of peak on SGEMM using Matsumoto et al. algorithm, and Fermi based GTX 580 also obtains about 63% of peak using CUBLAS.
For FFT, we tested the performance of 1D complex-to-complex inplace transforms of size 225 using the CUFFT library. Results are given below.
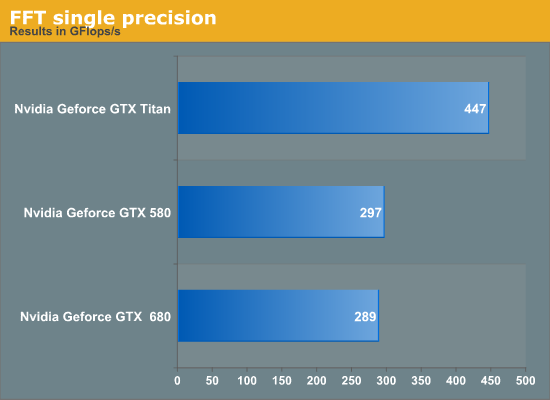
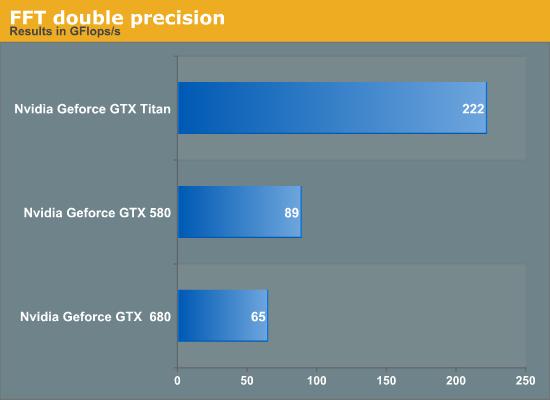
Titan outperforms the GTX 680 in FFT by about 50% in single-precision. We suspect this is primarily due to increased memory bandwidth on Titan compared to GTX 680 but we have not verified this hypothesis. GTX 580 has a slight lead over the GTX 680. Again, if time permits, we may return to the benchmark for a deeper analysis. Titan achieves about 3.4x the performance of GTX 680 but this is not surprising given the poor fp64 execution resources on the GTX 680.
We then looked at an in-house benchmark called SystemCompute, developed by our own Ian Cutress. The benchmark tests the performance on a variety of sample kernels that are representative of some scientific computing applications. Ian described the CPU version of these benchmarks in a previous article. Ian wrote the GPU version of the benchmarks in C++ AMP, which is a relatively new GPGPU API introduced by Microsoft in VS2012.
Microsoft's implementation of AMP compiles down to DirectCompute shaders. These are all single-precision benchmarks and should run on any DX11 capable GPU. The benchmarks include 2D and 3D finite difference solvers, 3d particle movement, n-body benchmark and a simple matrix multiplication algorithm. Boost is enabled on both the Titan and GTX 680 for this benchmark. We give the score reported by the benchmark for both cards, and report the speedup of the Titan over 680. Speedup greater than 1 implies Titan is faster, while less than 1 implies a slowdown.
| Benchmark | GTX 580 | GTX 680 | GTX Titan |
Speedup of Titan over GTX 680 |
| 2D FD | 9053 | 8445 | 12461 | 1.47 |
| 3D FD | 3133 | 3827 | 5263 | 1.37 |
| 3DPmo | 41722 | 26955 | 40397 | 1.49 |
| MatMul | 172 | 197 | 229 | 1.16 |
| nbody | 918 | 1517 | 2418 | 1.59 |
The benchmarks show between 16% and 60% improvement, with the most improvement coming from the relatively FLOP-heavy n-body benchmark. Interestingly, GTX 580 wins over the Titan in 3DPMo and wins over the 680 in 3DPmo and 2D.
Overall, GTX Titan is an impressive accelerator from compute perspective and posts large gains over its predecessors.


337 Comments
View All Comments
Ryan Smith - Thursday, February 21, 2013 - link
PCI\VEN_10DE&DEV_1005&SUBSYS_103510DEI have no idea what a Tesla card's would be, though.
alpha754293 - Thursday, February 21, 2013 - link
I don't suppose you would know how to tell the computer/OS that the card has a different PCI DevID other than what it actually is, would you?NVIDIA Tesla C2075 PCI\VEN_10DE&DEV_1096
Hydropower - Friday, February 22, 2013 - link
PCI\VEN_10DE&DEV_1022&SUBSYS_098210DE&REV_A1For the K20c.
brucethemoose - Thursday, February 21, 2013 - link
"This TDP limit is 106% of Titan’s base TDP of 250W, or 265W. No matter what you throw at Titan or how you cool it, it will not let itself pull more than 265W sustained."The value of the Titan isn't THAT bad at stock, but 106%? Is that a joke!?
Throw in an OC for OC comparison, and this card is absolutely ridiculous. Take the 7970 GE... 1250mhz is a good, reasonable 250mhz OC on air, a nice 20%-25% boost in performance.
The Titan review sample is probably the best case scenario and can go 27MHz past turbo speed, 115MHZ past base speed, so maybe 6%-10%. That $500 performance gap starts shrinking really, really fast once you OC, and for god sakes, if you're the kind of person who's buying a $1000 GPU, you shouldn't intend to leave it at stock speeds.
I hope someone can voltmod this card and actually make use of a waterblock, but there's another issue... Nvidia is obviously setting a precedent. Unless they change this OC policy, they won't be seeing any of my money anytime soon.
JarredWalton - Thursday, February 21, 2013 - link
As someone with a 7970GE, I can tell you unequivocally that 1250MHz on air is not at all a given. My card can handle many games at 1150MMhz, but other titles and applications (say, running some compute stuff) and I'm lucky to get stability for more than a day at 1050MHz. Perhaps with enough effort playing with voltage mods and such I could improve the situation, but I'm happier living with a card for a couple years that doesn't crap out because of excessively high voltages.CeriseCogburn - Saturday, February 23, 2013 - link
" After a few hours of trial and error, we settled on a base of the boost curve of 9,80 MHz, resulting in a peak boost clock of a mighty 1,123MHz; a 12 per cent increase over the maximum boost clock of the card at stock.Despite the 3GB of GDDR5 fitted on the PCB's rear lacking any active cooling it too proved more than agreeable to a little tweaking and we soon had it running at 1,652MHz (6.6GHz effective), a healthy ten per cent increase over stock.
With these 12-10 per cent increases in clock speed our in-game performance responded accordingly."
http://www.bit-tech.net/hardware/2013/02/21/nvidia...
Oh well, 12 is 6 if it's nVidia bash time, good job mr know it all.
Hrel - Thursday, February 21, 2013 - link
YES! 1920x1080 has FINALLY arrived. It only took 6 years from when it became mainstream but it's FINALLY here! FINALLY! I get not doing it on this card, but can you guys PLEASE test graphics cards, especially laptop ones, at 1600x900 and 1280x720. A lot of the time when on a budget playing games at a lower resolution is a compromise you're more than willing to make in order to get decent quality settings. PLEASE do this for me, PLEASE!JarredWalton - Thursday, February 21, 2013 - link
Um... we've been testing 1366x768, 1600x900, and 1920x1080 as our graphics standards for laptops for a few years now. We don't do 1280x720 because virtually no laptops have that as their native resolution, and stretching 720p to 768p actually isn't a pleasant result (a 6.7% increase in resolution means the blurring is far more noticeable). For desktop cards, I don't see much point in testing most below 1080p -- who has a desktop not running at least 1080p native these days? The only reason for 720p or 900p on desktops is if your hardware is too old/slow, which is fine, but then you're probably not reading AnandTech for the latest news on GPU performance.colonelclaw - Thursday, February 21, 2013 - link
I must admit I'm a little bit confused by Titan. Reading this review gives me the impression it isn't a lot more than the annual update to the top-of-the-line GPU from Nvidia.What would be really useful to visualise would be a graph plotting the FPS rates of the 480, 580, 680 and Titan along with their release dates. From this I think we would get a better idea of whether or not it's a new stand out product, or merely this year's '780' being sold for over double the price.
Right now I genuinely don't know if i should be holding Nvidia in awe or calling them rip-off merchants.
chizow - Friday, February 22, 2013 - link
From Anandtech's 7970 Review, you can see relative GPU die sizes:http://images.anandtech.com/doci/5261/DieSize.png
You'll also see the prices of these previous flagships has been mostly consistent, in the $500-650 range (except for a few outliers like the GTX 285 which came in hard economic times and the 8800Ultra, which was Nvidia's last ultra-premium card).
You an check some sites that use easy performance rating charts, like computerbase.de to get a quick idea of relative performance increases between generations, but you can quickly see that going from a new generation (not half-node) like G80 > GT200 > GF100 > GK100/110 should offer 50%+ increase, generally closer to the 80% range over the predecessor flagship.
Titan would probably come a bit closer to 100%, so it does outperform expectations (all of Kepler line did though), but it certainly does not justify the 2x increase in sticker price. Nvidia is trying to create a new Ultra-premium market without giving even a premium alternative. This all stems from the fact they're selling their mid-range part, GK104, as their flagship, which only occurred due to AMD's ridiculous pricing of the 7970.